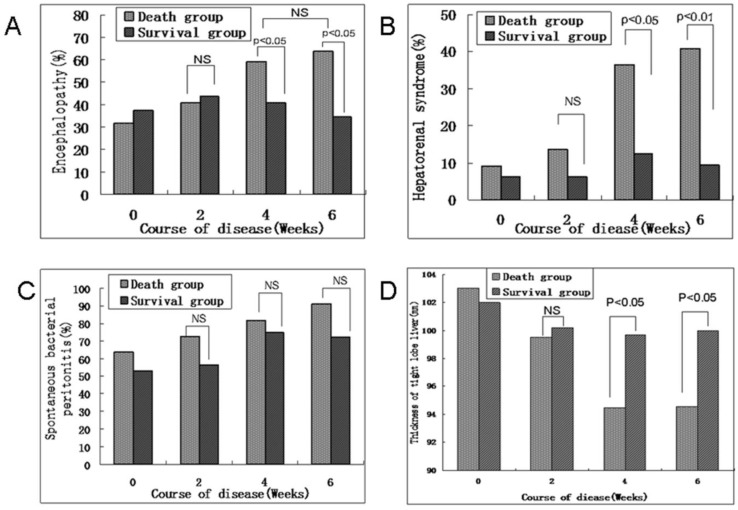
Fig 2.
(A) Dynamic state of the hepatic encephalopathy rate in the death and survival groups during the course of ACHBLF progression. (B) Dynamic state of the hepatorenal syndrome rate in the death and survival groups during the course of ACHBLF progression. (C) Dynamic state of the spontaneous bacterial peritonitis rate in the death and survival groups during the course of ACHBLF progression. (D) Thickness of the right lobe of the liver by ultrasound scanning in the death and survival groups during the course of ACHBLF progression. The numbers at the top of the chart indicate the p values for differences between the respective groups. NS, no statistical significance. Data are described as percentages. ACHBLF, acute-on-chronic hepatitis B liver failure.

