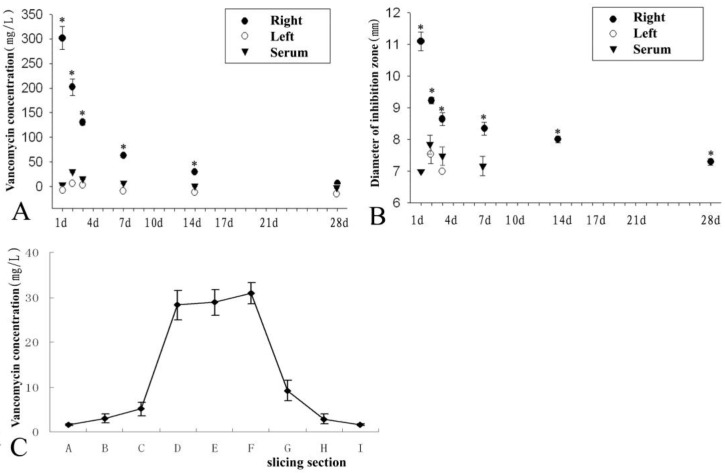
Fig 5.
The vancomycin concentration was detected from different samples of the right graft (EXP group), the left graft (CON group), and serum (A). The diameter of the inhibition zone of the tissue fluid from the EXP group, CON group, and serum was analysed in (B). There was a trend of decreasing vancomycin concentration among EXP group, CON group, and serum in Figures A and B. On the 14th day post-operation, sections of the EXP group (see Figure 1) showed the highest vancomycin concentration in the grafted tissue in the middle of the femur, while vancomycin concentration in the tissue gradually decreased from the middle to both ends of the femur (C). * represents a significant difference in each phase between the EXP and CON groups (P<0.05).

