Figure 1.

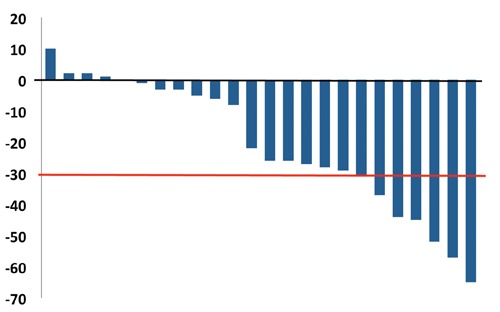
Waterfall plot demonstrating the percentage variation of tumor lesion size. Red line indicates 30% shrinkage (Partial response by RECIST criteria).

Waterfall plot demonstrating the percentage variation of tumor lesion size. Red line indicates 30% shrinkage (Partial response by RECIST criteria).