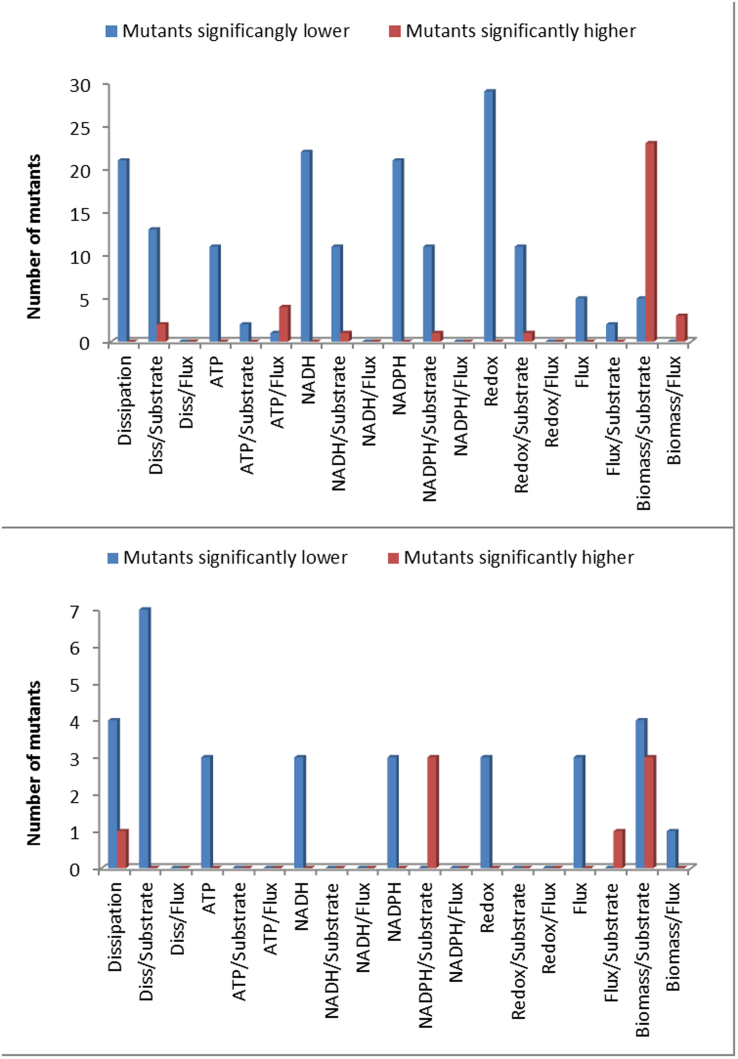
Figure 2. The bars represent the number of deletion mutants (and evolved strains for E. coli) that showed higher or lower values for each systemic function with a probability higher than 95%.
The biomass yield shows higher values in many deletion mutants than in the wild type. The turnover rate of redox cofactors seems to be a suitable objective function (maximal in the wild type).

