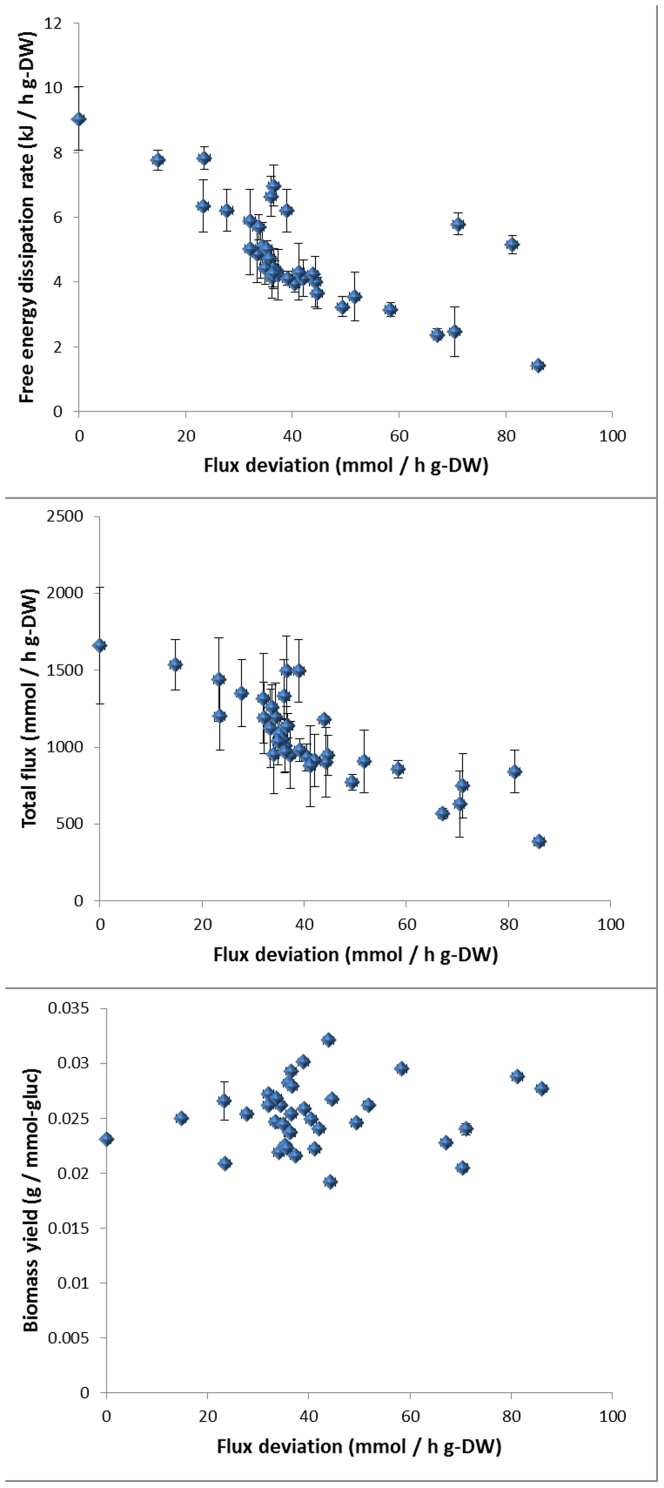
Figure 3. Here we plot the average value of three of the systemic functions against the Euclidean distance of the flux distributions with respect to the wild type in S. cerevisiae (this gives an idea of how these functions tend to change when the flux distributions differ more from the wild type distribution.
The error bars are the standard deviations of each systemic function (calculated from the random sampling). We see that the total flux and the energy dissipation rate tend to decrease with the deviation from the wild type flux distribution, the biomass yield however takes both higher and lower values.

