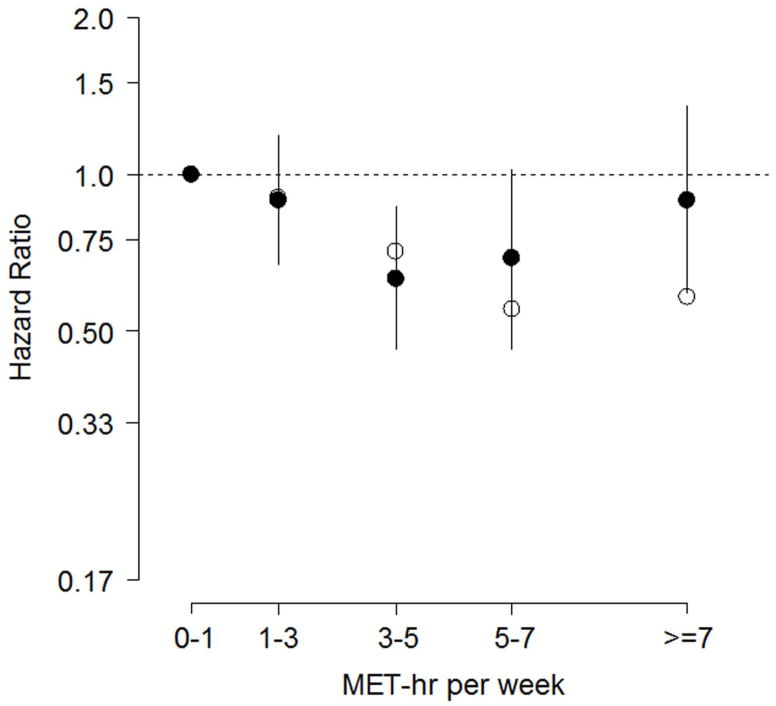
Figure 2. Hazard Ratios for All-cause Mortality or Hospitalization.
Among patients event-free for at least three months, adjusted hazard ratios (filled circles, log scale) for all-cause mortality or hospitalization with 95% confidence intervals; reference category is 0–1 MET-hr per week. Unadjusted hazard ratios are plotted with open circles.

