Figure 5.
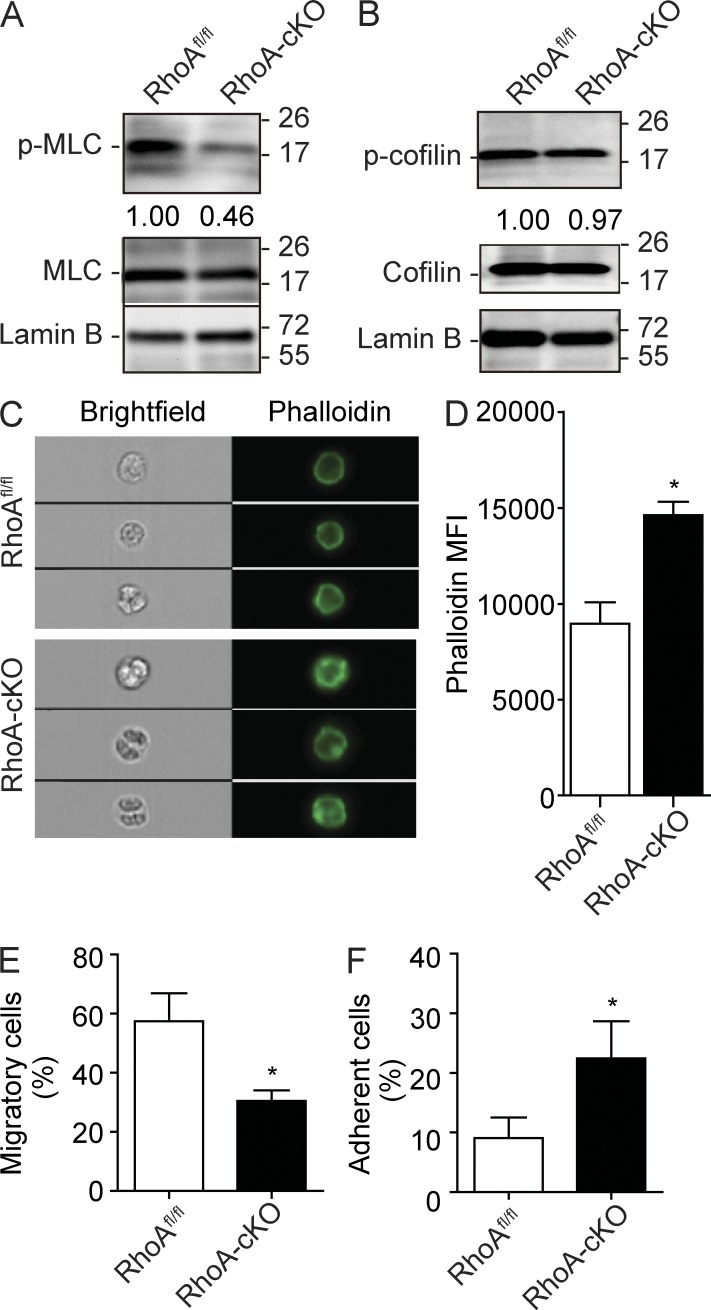
RhoA regulates HSPC actomyosin signaling, migration, and adhesion. (A) MLC phosphorylation (Ser19) in Lin− BM cells 3 d after poly I:C induction. Relative MLC phosphorylation was determined by normalizing to total MLC expression. (B) Cofilin (Ser3) phosphorylation in isolated Lin− BM cells 3 d after poly I:C induction. Relative cofilin phosphorylation was determined by normalizing to total cofilin. (A and B) Molecular masses (kilodaltons) are indicated to the right of the blots. (C and D) Cortical F-actin formation in response to 100 ng/ml SDF-1α stimulation in Lin− cells. Lin− cells were isolated from mice 3 d after induction and stained with Alexa Fluor 488 phalloidin. (C) Representative ImageStream images of F-actin staining in Lin− cells. (D) Quantification of cortical F-actin signaling. MFI, mean fluorescence intensity. (E) Lin− BM cells were cultured in the top chamber of Transwells. 100 ng/ml SDF-1α was added into the bottom chamber as a chemoattractant. The percentage of cells migrated into the bottom chamber 4 h later is shown. (F) Lin− BM cells were cultured at 37°C for 2 h in CH-296–coated 96-well plates containing IMDM supplemented with 10% FBS. Nonadherent cells were removed, and the percentage of adherent cells is shown. Cells used in this figure were isolated from poly I:C–injected RhoAfl/fl; Mx-Cre+ or Mx-Cre− mice. Numbers of samples analyzed: three (D and F) or four (E) mice per group. The results from a representative experiment of two (A–E) or four (F) independent experiments are shown. Error bars indicate SEM. *, P < 0.05.

