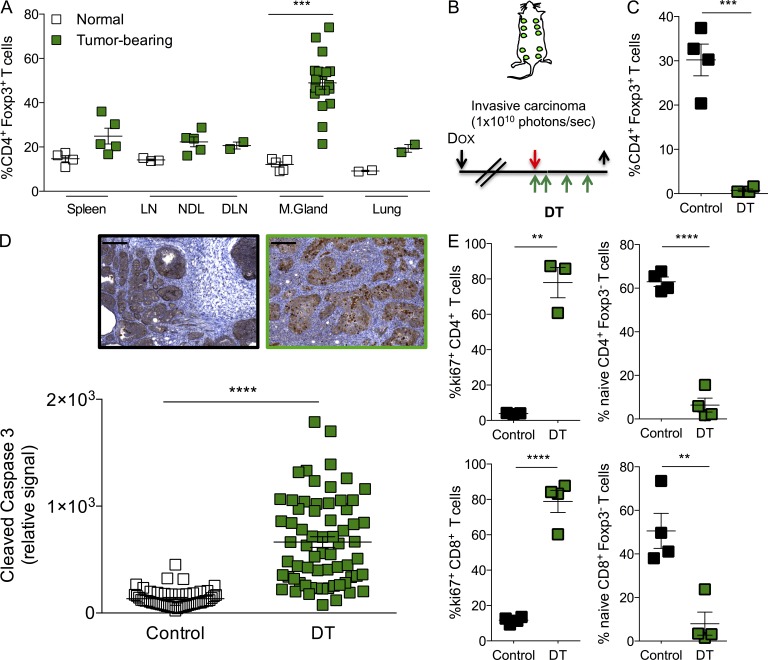
Figure 2.
Ablation of T reg cells results in tumor cell death in autochthonous breast tumors. (A) Frequency of CD4+ Foxp3+ T reg cells in indicated organs of control (clear squares) and tumor-bearing (green squares) MMTV-rtTA; tet-O-PyMT (TOMT) mice. ***, P < 0.001. (B) Schedule of DT treatment in TOMT mice. Black arrows indicate days of doxycycline administration (↓) and analysis (↑). Red arrow indicates day the tumors reach mass emitting 1010 photons per second. Green arrows indicate administration of DT. (C) Flow cytometric quantification of intratumoral CD4+ Foxp3+ T reg cells at end point (10 d after the first DT injection). A representative of at least three independent experiments is shown, n = 4; ***, P < 0.001. (D) Histological quantification and representative images of tumor cell death by cleaved caspase-3 immunohistochemistry. n = 3–7 mice per group; ****, P < 0.0001; bars, 200 µm. (E) Flow cytometric determination of the frequency of intratumoral proliferating (Ki67+) and naive (CD62LhighCD44lo) CD4+ and CD8+ T cells. A representative of at least three independent experiments is shown; n = 3–4 mice per group. Error bars represent SEM. **, P < 0.01; ****, P < 0.0001. NDL: nondraining LN; DLN: draining LN; M. Gland: mammary gland. P-values were calculated using Student’s t test.

