Figure 4.
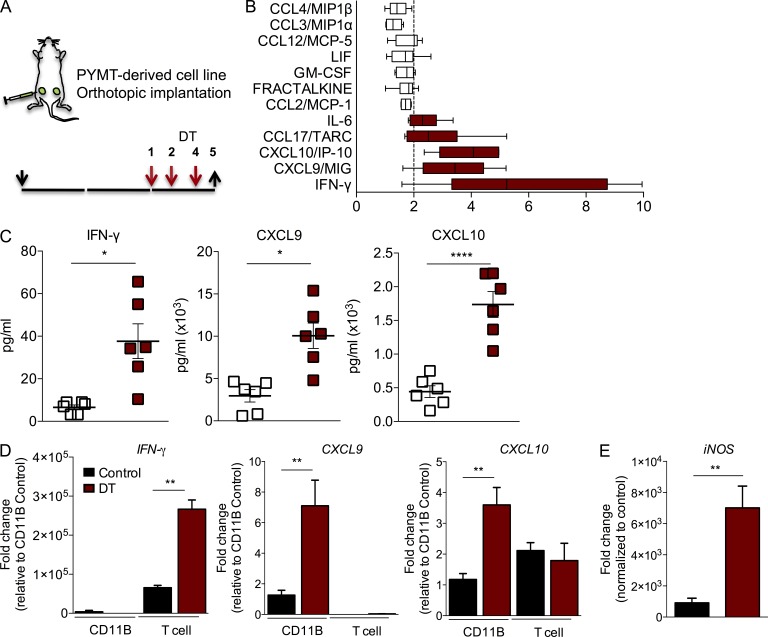
T reg cell ablation results in increased production of IFN-γ and IFN-γ–dependent changes. (A) Scheme of DT treatment. Black arrows indicate day of tumor implantation (↓) and analysis (↑). Red arrows indicate regimen of DT treatment. (B) Significant changes in chemokine and cytokine levels in tumor lysates from DT-treated mice analyzed by cytokine/chemokine array. X-axis represents fold change compared with control. A representative of two independent experiments is shown, n = 3 mice with two tumors each analyzed per group. Error bars represent minimum and maximum. (C) Analysis of IFN-γ, CXCL9, and CXCL10 protein levels in tumor lysates from control and DT-treated mice using multiplex bead assay. The data are shown as concentrations of indicated factors (pg/ml). A representative of two independent experiments is shown. *, P < 0.05; ****, P < 0.0001. Error bars represent SEM. (D) qPCR analysis of cell type–specific expression of IFN-γ, CXCL9, and CXCL10. RNA was extracted from CD45+ TCR-β− CD11B+ Gr1− or CD45+ TCR-β+ CD11B− FACS-purified cells; n = 3 mice per group; **, P < 0.01. Error bars represent SEM. (E) qPCR analysis of iNOS, consistent with classical polarization of myeloid cells; n = 3 mice per group. Error bars represent SEM. **, P < 0.01. P-values were calculated using Student’s t test.

