Figure 9.
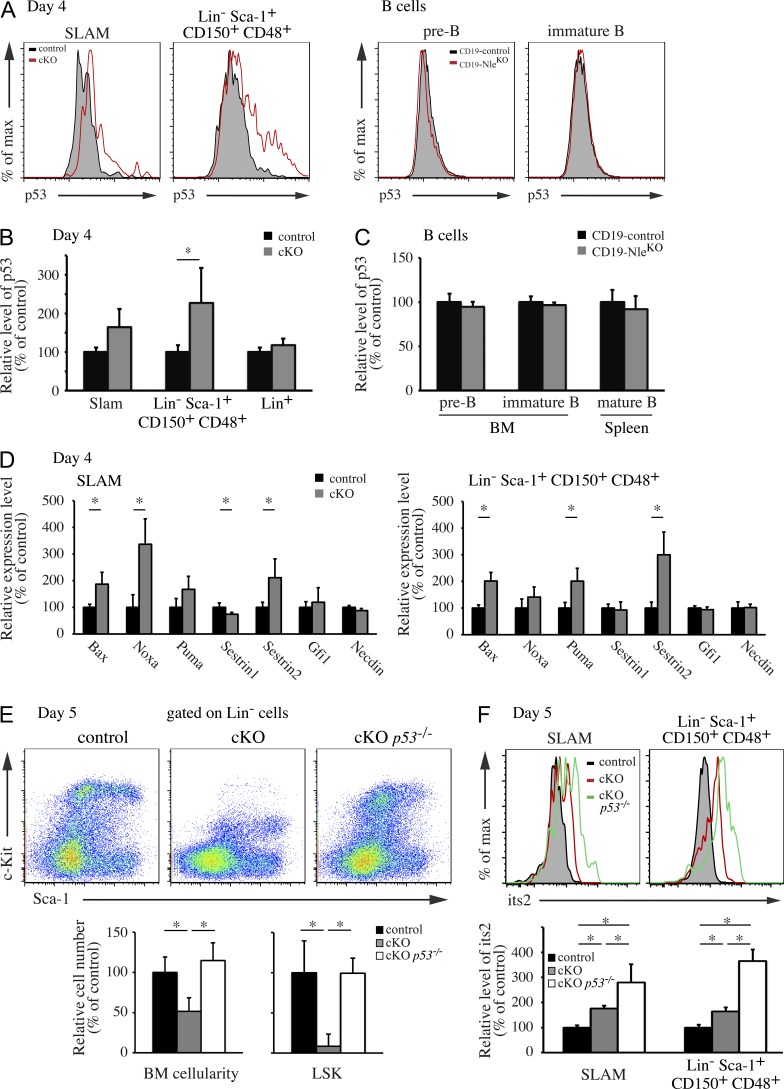
Rapid BM cytopenia is mediated by p53. (A, left) Representative histograms for p53 labeling in SLAM cells and MPPs (Lin− Sca-1+ CD150+ CD48+) at day 4 after Cre induction from control and NlecKO mice. (right) Representative histograms for p53 labeling in BM pre-B and immature B cells from CD19-control and CD19-NleKO mice. (B) Quantification of p53 levels in populations from control and cKO mice. Bars are means (SD) of n = 4 mice per genotype. (C) Quantification of p53 levels in B cell populations from CD19-control and CD19-NleKO mice. Bars are means (SD) of n = 3 mice per genotype. Data are from one representative of two experiments. (D) Relative expression levels of p53 target genes measured by RT-QPCR in SLAM cells and MPPs from control and NlecKO mice at day 4 after Cre induction. Bars are means (SD) of n = 4 mice. Data are from one representative of two experiments. (E) Representative FACS profiles obtained 5 d after Cre induction from control, NlecKO, and NlecKO p53−/− (Rosa26CreERT2/+; NleFlox/null; p53−/−) mice. The BM cellularity and the number of LSK cells are shown for the three genotypes. Bars are means (SD) for n = 4–6 mice per genotype. This experiment was performed twice. (F) Its2 labeling by FISH was performed on BM cells from control, NlecKO, and NlecKO p53−/− mice 5 d after Cre induction. Representative histograms for the levels of its2 in SLAM cells and MPPs (Lin− Sca-1+ CD150+ CD48+) and quantification of its2 intensity are shown. Bars are means (SD) for n = 4–6 mice per genotype. This experiment was performed twice. *, P < 0.05.

