Figure 2.
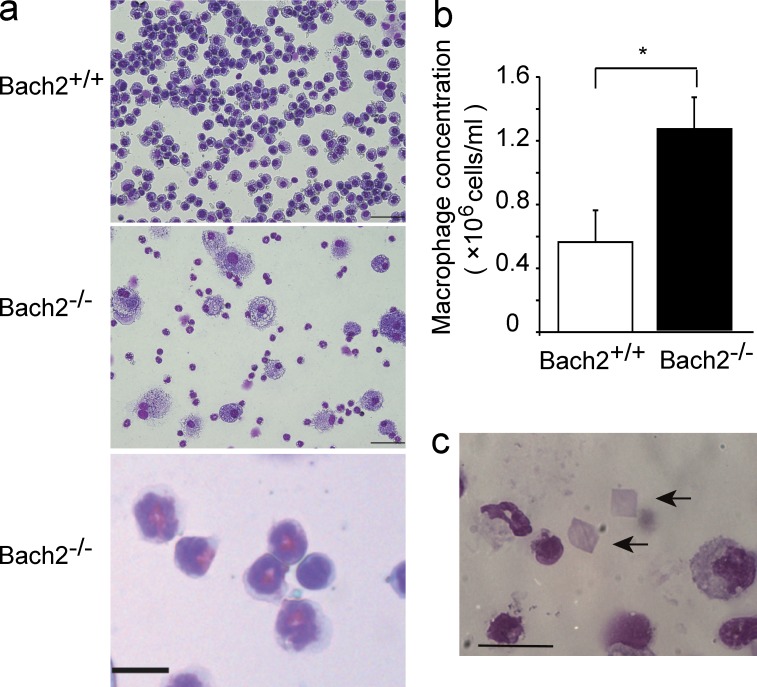
PAP-like disease in Bach2-deficient mice. (a) May-Giemsa staining of BAL cells from WT and Bach2-deficient mice. Bars, 100 µm. An enlarged panel is at the bottom to show eosinophils (bar, 10 µm). (b) Cell concentrations of AMs in BAL fluids from WT and Bach2-deficient mice. The mean values from five mice for each group are shown. Error bars represent SD. P-values were obtained by two-tailed Student’s t-tests. *, P < 0.05. (c) Crystal polygons (arrows) in the BAL fluid from Bach2-deficient mice. Bar, 20 µm.

