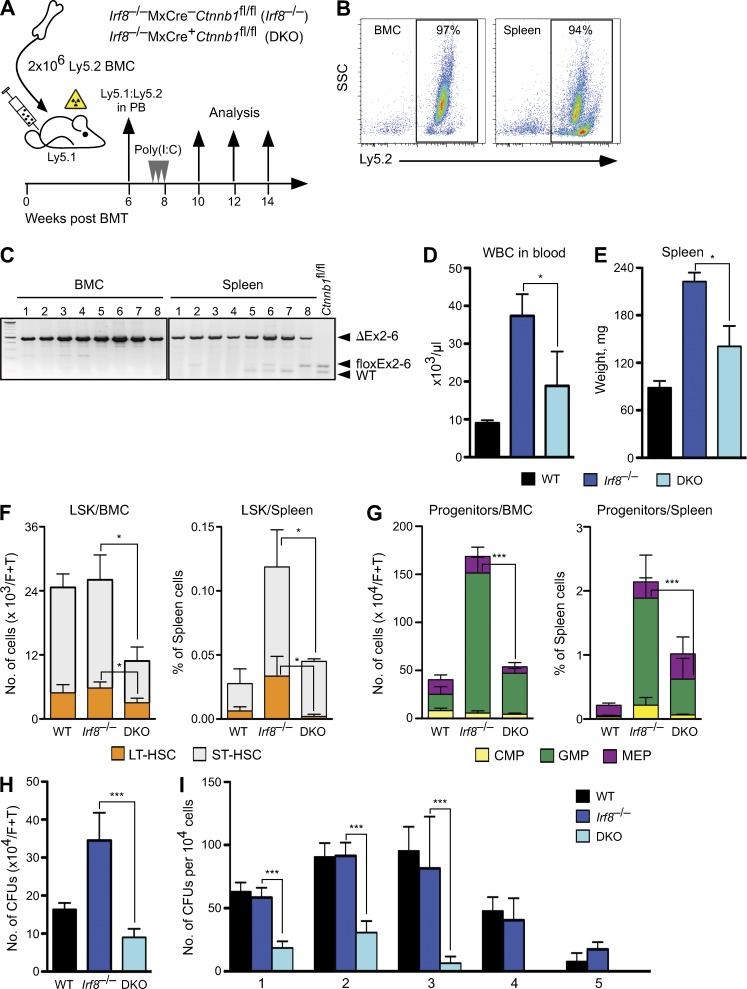
Figure 2.
Irf8-deficient CML requires β-catenin. (A) Schematic representation of the experimental procedures and genotypes used for BM cell transplantation into lethally irradiated recipients. WT, noninducible Irf8−/−MxCre–Ctnnb1fl/fl (Irf8−/−) and inducible double knockout mutant Irf8−/−MxCre+Ctnnb1fl/fl (DKO) BM cells (Ly5.2+) were injected into lethally irradiated congenic B6.SJL (Ly5.1+) hosts, n = 10 recipients for each genotype. After 6 wk, reconstituted recipients were treated with poly(I:C) three times every 2nd d. (B) BM and spleen engraftment of donor-derived cells (Ly5.2+) in B6.SJL (Ly5.1+) recipients 30 d after poly(I:C) treatment. (C) Whole BM and spleen from B6.SJL recipients genotyped for deletion of β-catenin. (D and E) β-Catenin deletion reduces Irf8−/− myeloproliferative disease. Three to four mice per genotype were used to determine number of WBC in peripheral blood (D) and the mean weights of spleen from recipient mice ± SD transplanted with WT, Irf8−/−, or DKO cells 30 dpi with poly(I:C) (E). (F and G) β-Catenin deletion results in reduction of stem and progenitor cells in recipients bearing DKO cells. Data represent mean ± SD from one experiment 30 d after the last p(I:C) injection, three to four mice per genotype were used. (F) Displayed are absolute number of LSKs in BM (left) and frequency of LSK in spleen (right). LSK compartment was subfractioned into LT-HSC and ST-HSC based on the surface expression of CD150 and Flt3 by FACS. (G) Absolute number of myeloid progenitors, separated as CMP, GMP, and MEP in BM (left) and their frequency in spleen (right) by FACS is shown. (H) Number of colonies derived from BM cells of recipients (described in D and E) tested in CFU assay. CFU per 2 × 10⁴ cells were counted 7 d after cultivation and absolute numbers per femur and tibia are shown. Error bars indicate SD of mean number of colonies from triplicate cultures of each mouse (n = 3 in each group). (I) Serial replating assay of 1 × 10⁴ BM cells in methylcellulose medium from indicated genotypes. Colonies were counted after 5 d. The same number of cells was used for replating (five rounds). Error bars indicate SD of mean number of colonies from triplicate cultures of each mouse (n = 3 in each group). Results are representative of two determinations performed with BM and spleen cells. Statistics: (D–I) Student’s t test. *, P < 0.05; ***, P < 0.0001.

