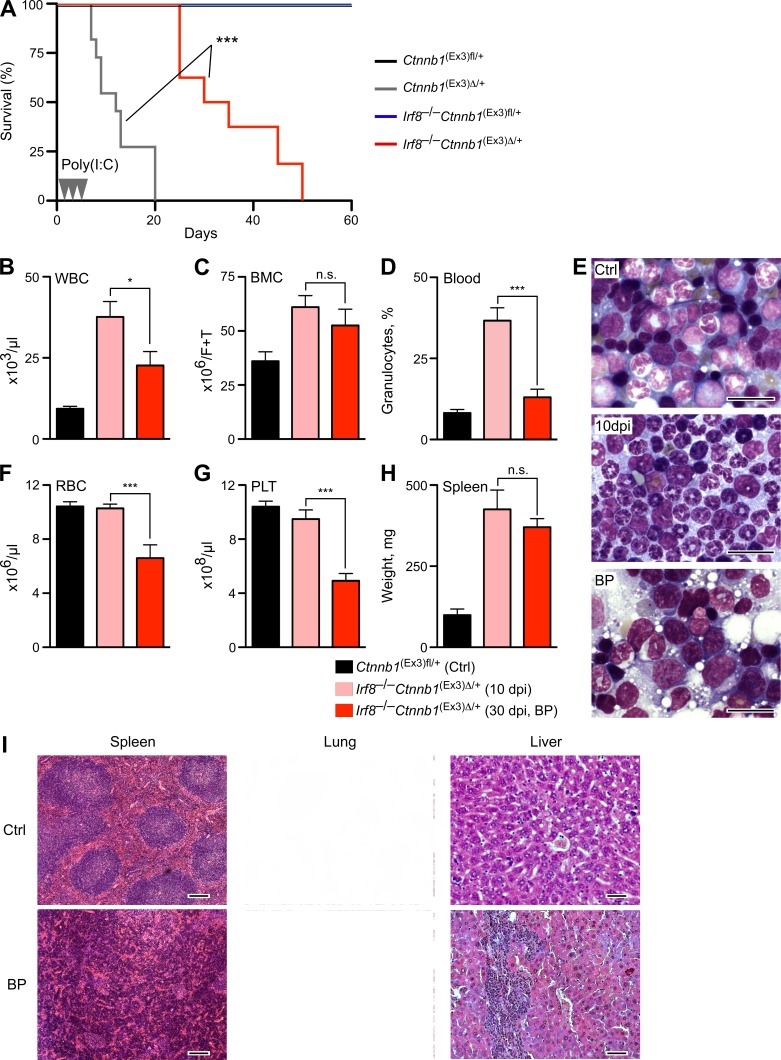
Figure 3.
Activation of β-catenin accelerates CML-like disease of Irf8−/− mice into blast crisis. (A) Kaplan-Meier survival curves of B6.SJL recipients transplanted with control MxCre−Ctnnb1(Ex3)fl/+ (denoted as Ctnnb1(Ex3)fl/+, n = 18), MxCre+Ctnnb1(Ex3)fl/+ (denoted as Ctnnb1(Ex3)Δ/+, n = 20), Irf8−/−MxCre−Ctnnb1(Ex3)fl/+ (denoted as Irf8−/−Ctnnb1(Ex3)fl/+, n = 16), and Irf8−/−MxCre+Ctnnb1(Ex3)fl/+ (denoted as Irf8−/−Ctnnb1(Ex3)Δ/+, n = 20) are shown, and poly(I:C) injections are indicated as arrowheads. Log-rank (Mantel-Cox) test. ***, P < 0.0001. (B–H) Comparison of hematopoietic parameters during progression of CML-like disease from initial phase (10 dpi with poly(I:C), pink) to BP (30 dpi, red) versus Irf8+/+MxCre−Ctnnb1(Ex3)fl/+ (Ctrl). (B) Absolute number of WBCs in peripheral blood (×106/ml). (C) BM cells (BMC, ×106 cells/femur+tibia). (D) Percentage of granulocytes in peripheral blood. (E) A representative May-Grunwald-Giemsa staining of BM smears from recipients bearing control and double mutated Irf8−/−Ctnnb1(Ex3)Δ/+ cells after 10 dpi and in BP (30 dpi) are shown. Bars, 20 µm. (F) RBC (106/µl) counts. (G) Platelet counts (PLT, 106/µl). (H) Weights of the spleens (in milligrams) are shown. Results are displayed as mean values ± SEM from six to eight mice in each group. Statistics: (B–H) Student’s t test. n.s., not significant; *, P < 0.05; ***, P < 0.0001. (I) Representative histology (H&E stain) of CML-like BP disease in spleen, liver, and lung from recipients bearing Irf8−/−Ctnnb1(Ex3)Δ/+ versus control (Ctrl) cells. Bars: (spleen) 200 µm; (lung) 100 µm; (liver) 50 µm.

