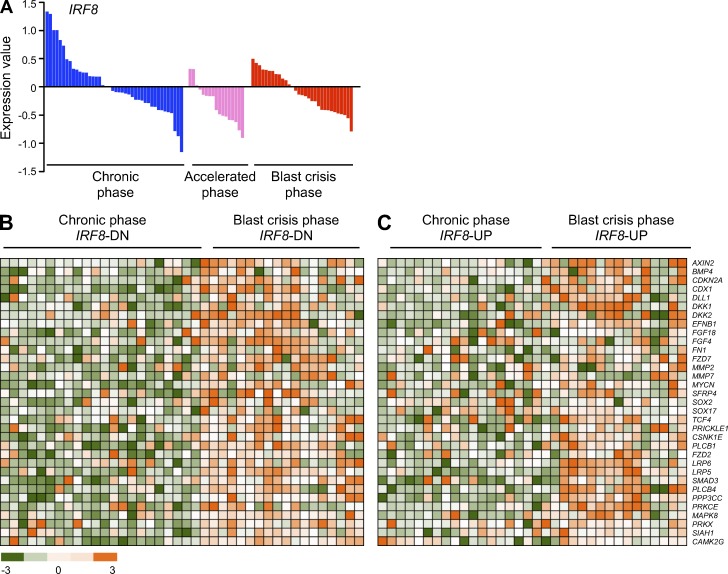
Figure 5.
Gene expression profile in BM or PB from chronic and BP CML patients. (A) Expression of IRF8 (P < 0.05) in BM or PB from CP (blue), accelerated phase (pink), and BP (red) CML patients is displayed in linear scale. Data were analyzed using R/Bioconductor, and moderated t-statistics using the limma package. (B and C) The samples were separated into IRF8-down (IRF8-DN, B) and IRF8-up-regulated (IRF8-UP, C) subgroups. Heatmaps show representative Wnt target genes. Microarray data were taken from the Gene Expression Omnibus under accession no. GSE4170.

