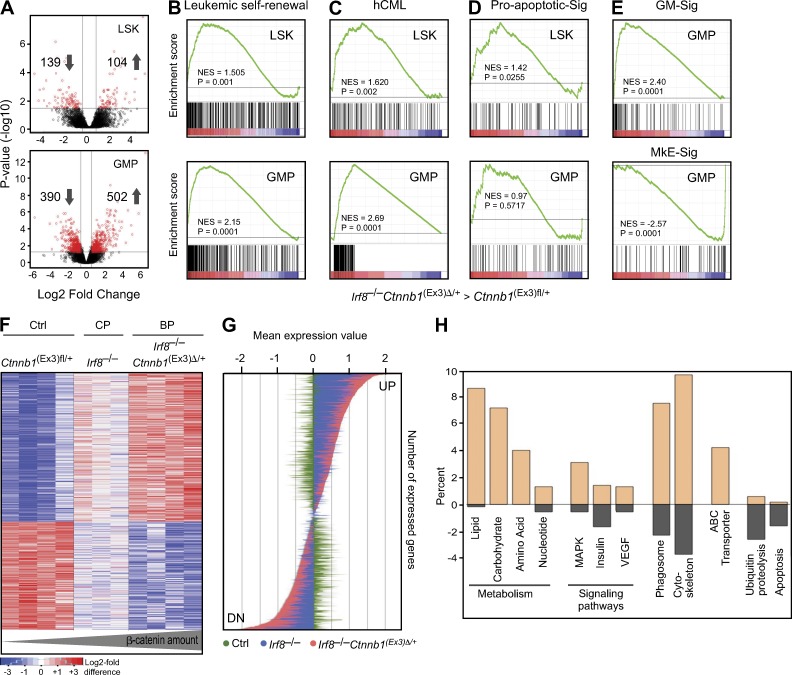
Figure 6.
Gene expression profile of leukemic LSKs and GMPs. (A) Comparison of significantly differently expressed genes between control Ctnnb1(Ex3)fl/+ and Irf8−/−Ctnnb1(Ex3)Δ/+ cells from sorted LSK (top) and GMP (bottom) populations is shown in Volcano plots. The negative log10-transformed p-values are plotted against log2 fold change. Red dots represent significant differentially expressed probe sets. (B–E) Comparison by GSEA between LSKs (top) and GMPs (bottom) from Irf8−/−Ctnnb1(Ex3)Δ/+. Each population was compared individually to LSK and GMPs from control Ctnnb1(Ex3)fl/+ profiles. Plots show enrichment/depletion of leukemic self-renewal associated genes derived from MLL-AF9-transduced L-GMPs (B) and up-regulated gene set from human CML patients (165 genes in enrichments core; C) and genes involved in proapoptotic signature (D; Reactome). (E) GSEA plots from Irf8–/–Ctnnb1(Ex3)Δ/+ GMPs compared with control Ctnnb1(Ex3)fl/+ GMPs showing enrichment/depletion of granulocytic/monocytic- (GM-Sig, top) and megakaryocytic/erythroid (MkE-Sig, bottom)-associated gene expression set. The NES and p-values are indicated on each plot. (F) Heatmap of significantly deregulated genes in GMPs from BP and CP compared with control establish a PSS; Pearson’s correlation coefficient and Ward’s method were used. (G) Expression values of up- and down-regulated genes as depicted in PSS. BP (red, genes in Irf8–/–Ctnnb1(Ex3)Δ/+ GMPs) as compared with CP (blue, genes in Irf8–/– GMPs) and control (green, genes in Ctnnb1(Ex3)fl/+ GMPs). The y-axis represents different genes from the PSS; the x-axis depicts the median expression value for every gene, which were row-wise median centered. (H) Gene ontology classification of genes selectively expressed in PSS. The percentage of each functional category represents numbers of gene transcripts that were more abundant in PSS profile than in control GMPs (plus value, up-regulated; minus value, down-regulated genes).

