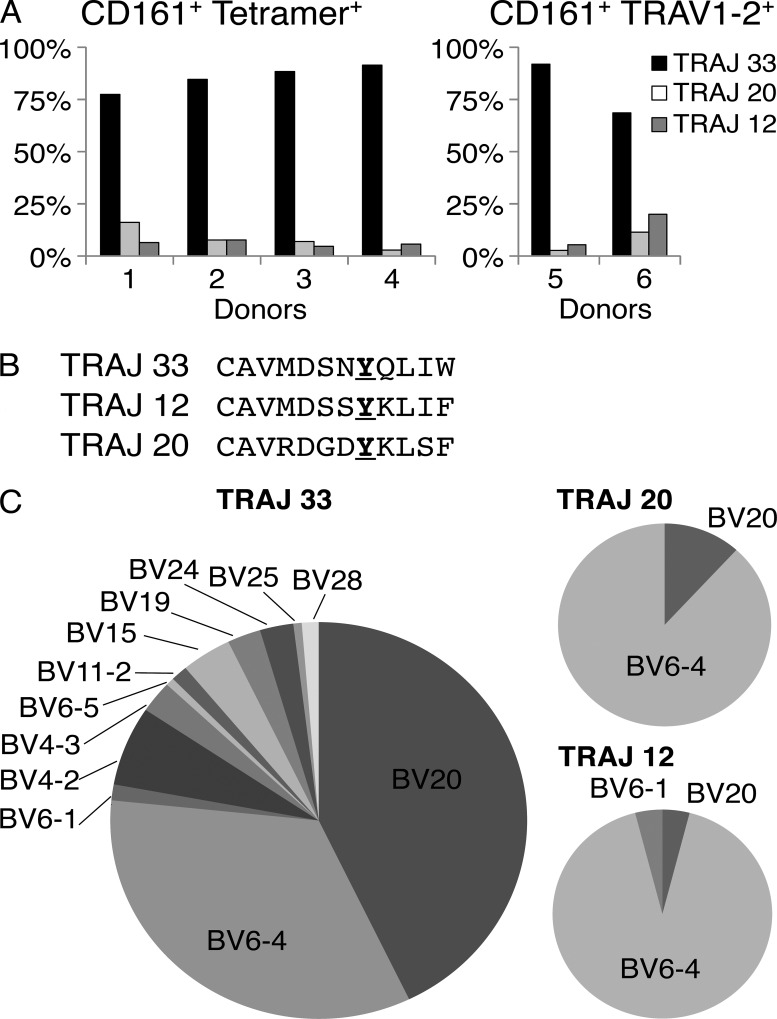
Figure 3.
Characterization of MR1-Ag tetramer-reactive MAIT cells. (A) Bar graphs showing TRAJ usage of CD3+CD4−CD161hitetramer+ cells (all of which expressed TRAV1-2; left, donors 1–4) or CD3+CD4−CD161hiTRAV1-2+ cells (stained with the TRAV1-2–specific mAb 3C10; right, donors 5 and 6). Bars represent percentage of total sequences (n = 32 [donor 1], 13 [donor 2], 43 [donor 3], 35 [donor 4], 37 [donor 5], and 35 [donor 6]) obtained from PCR amplification. (B) Alignment of CDR3α regions of TRAV1-2 TCR α-chains containing TRAJ33, TRAJ12, and TRAJ20 segments from CD161+tetramer+ cells. The conserved Tyr95α residue is highlighted in bold and underlined. (C) Pie charts comparing TRBV usage of MAIT cells with TRAV1-2 α-chains containing either TRAJ33 (left), TRAJ20 (top right), or TRAJ12 segments (bottom right; n, total number of paired sequences pooled from donors 1–6, = 154 [TRAJ33], 17 [TRAJ20], and 25 [TRAJ12]).

