Figure 8.
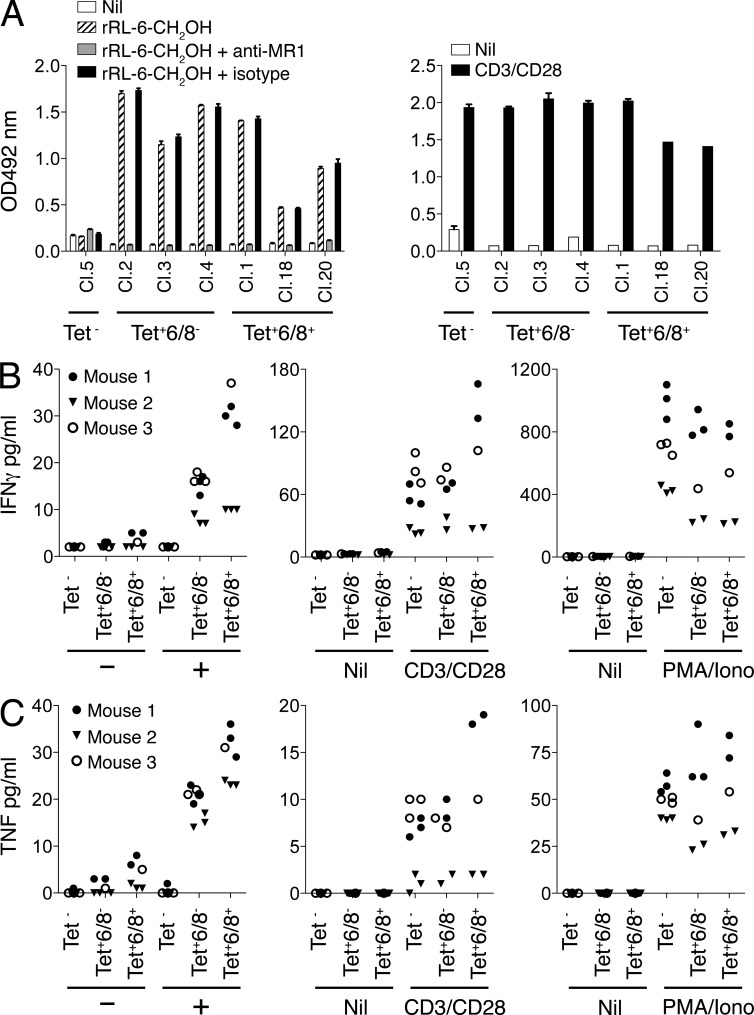
Characterization of MR1-Ag tetramer–reactive mouse MAIT cells. (A) Activation of both Vβ6/Vβ8− and Vβ6/Vβ8+ BW5147-MAIT hybridomas by rRL-6-CH2OH. BW5147-MAIT hybridomas, either nonreactive with rRL-6-CH2OH–loaded MR1 tetramer (Tet−; Clone 5: Cl.5) or either MR1-Ag tetramer+Vβ6/Vβ8− (Tet+6/8−; Cl.2,3,4) or MR1-Ag tetramer+Vβ6/Vβ8+ (Tet+6/8+; Cl.1,18,20) were then (left) coincubated with M12.C3.MR1 cells in the absence (Nil) or presence of 15.2 µM rRL-6-CH2OH or presence of 15.2 µM rRL-6-CH2OH with prior addition of either the MR1-reactive mAb 26.5 (+anti-MR1) or an isotype control mAb, W6/32 (+isotype). Alternatively (right), BW5147-MAIT hybridomas were incubated alone (Nil) or in the presence of CD3- and CD28-reactive mAbs. IL-2 release by BW5147-MAIT hybridomas was measured by the conversion of o-phenylenediamine dihydrochloride by horseradish peroxidase in an indirect ELISA assay, and absorption at 492 nm is shown on the y axis. Results are shown as mean and SEM of triplicates. This experiment was performed three times; shown is a representative experiment. (B and C) Activation of both Vα19iTg+ Vβ6/Vβ8− and Vβ6/Vβ8+ MAIT cells by rRL-6-CH2OH. Mouse splenocytes from three separate Vα19iTg-Cα−/−MR1+ littermates were stained with CD3- and Vβ6/Vβ8-reactive mAbs and rRL-6-CH2OH–loaded MR1 tetramer. Sorted CD3+MR1-Ag tetramer− (Tet−), CD3+MR1-Ag tetramer+Vβ6/Vβ8− (Tet+6/8−), or CD3+MR1-Ag tetramer+Vβ6/Vβ8+ (Tet+6/8+) cells were then coincubated with M12.C3.MR1 cells in the absence (−) or presence (+) of 15.2 µM rRL-6-CH2OH. Sorted T cells were also treated with either CD3- and CD28-reactive mAbs (CD3/CD28) or PMA and ionomycin (PMA/iono) or left untreated (Nil). Production (pg/ml) of IFN-γ (B) and TNF (C) by MAIT cells or control MR1-Ag tetramer–negative T cells was measured using a CBA assay after 24 h. These data are representative of two independent experiments. In this experiment, MAIT cells and T cells were separately sorted from three Vα19iTg-Cα−/−MR1+ littermates (mouse 1, MR1+/+; mouse 2, MR1+/−; mouse 3, MR1+/−), with each symbol representing an individual data point. Depending on numbers of available sorted cells, one to three in vitro replicates per parameter were tested. A similar result was obtained when this experiment was repeated with MAIT and T cells separately sorted from two Vα19iTg-Cα−/−MR1+ littermates.

