Figure 1.
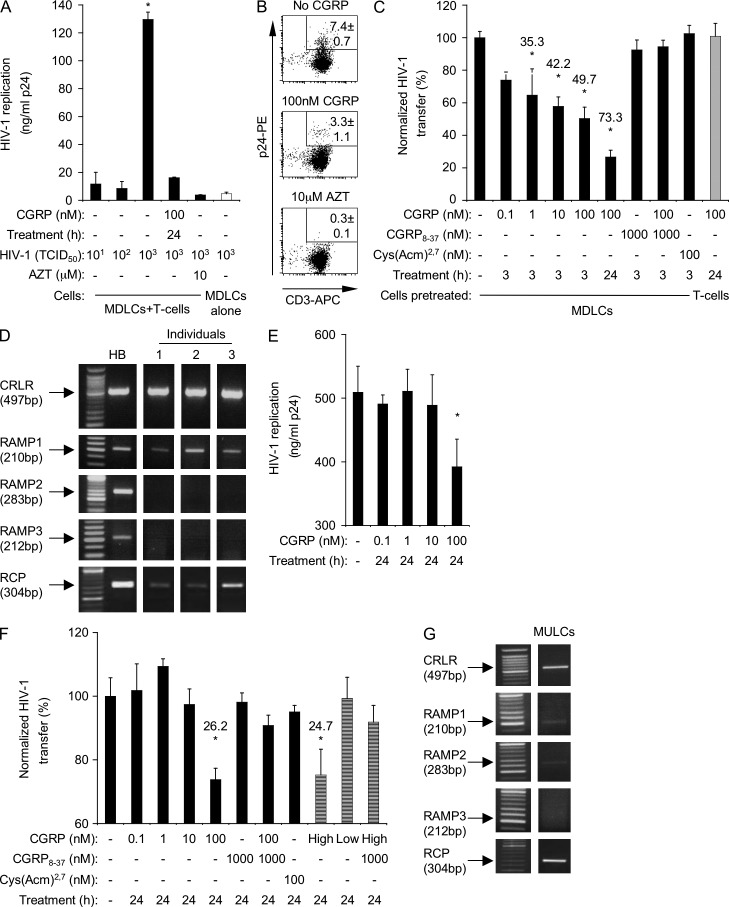
CGRP inhibits HIV-1 transfer from LCs to T cells. (A and B) MDLCs were left untreated or pretreated for 24 h with 100 nM CGRP. The cells were then pulsed with 101–103 (A) or 103 (B) TCID50 HIV-1 and co-cultured with autologous CD4+ T cells for 1 wk. Untreated MDLCs were also co-cultured with T cells in the presence of AZT or cultured alone (A, open bar). In A, HIV-1 replication was measured in the culture supernatants by p24 ELISA, and results represent mean ± SEM ng/ml p24 from duplicate wells of a representative experiment of n = 9; *, P < 0.0001; ANOVA. In B, the cells were collected at the end of the co-culture period, stained with CD3-APC (surface) and p24-PE (intracellular) mAbs, and examined by flow cytometry; shown are representative FACS plots, with numbers indicating the mean ± SEM percentages of CD3+p24+ infected T cells of n = 5 experiments. (C) MDLCs were left untreated or pretreated, as indicated, for 3–24 h with 0.1–100 nM CGRP, 1,000 nM CGRP8–37 (added alone or 10 min before addition of CGRP), or 100 nM Cys(Acm)2,7. The cells were then pulsed with 103 TCID50 HIV-1 and co-cultured with autologous CD4+ T cells for 1 wk. In some experiments, T cells were pretreated with CGRP and then co-cultured with untreated but HIV-1–pulsed MDLCs (gray bar). HIV-1 replication was measured in the co-culture supernatants by p24 ELISA, and results represent mean ± SEM from n = 9 experiments of HIV-1 transfer normalized against untreated cells serving as the 100% set point; numbers represent percentage of HIV-1 transfer inhibition; *, P = 0.0220 and 0.0003 and P < 0.0001 and 0.0001 for 1 nM/3 h, 10 nM/3 h, 100 nM/3 h, and 100 nM/24 h CGRP-treated versus untreated MDLCs, respectively. (D) RT-PCR images for CRLR, RAMP1-3, and RCP in MDLCs from three individuals with total human brain (HB) RNA serving as positive control. (E and F) MULCs were left untreated or pretreated for 24 h with 0.1–100 nM CGRP, culture supernatants of TT cells containing 70 nM (high) or 4 nM (low) CGRP (F, striped bars), 1,000 nM CGRP8–37 (added alone or 10 min before addition of CGRP), or 100 nM Cys(Acm)2,7, as indicated. The cells were then pulsed with 103 TCID50 HIV-1 and co-cultured with CD4+ T cells for 1 wk. HIV-1 replication was measured in the co-culture supernatants by p24 ELISA, and results of n = 5 experiments are presented as in A and B, respectively; p24 level of untreated MULCs cultured alone was 12.0 ± 0.2 ng/ml; *, P = 0.0315 for MULCs pretreated with 100 nM CGRP versus untreated MULCs (E); *, P = 0.0008 and 0.0338 for MULCs pretreated with 100 nM CGRP and high CGRP versus untreated MULCs, respectively (F). (G) RT-PCR images for CRLR, RAMP1-3, and RCP in MULCs (representative of n = 3 experiments).

