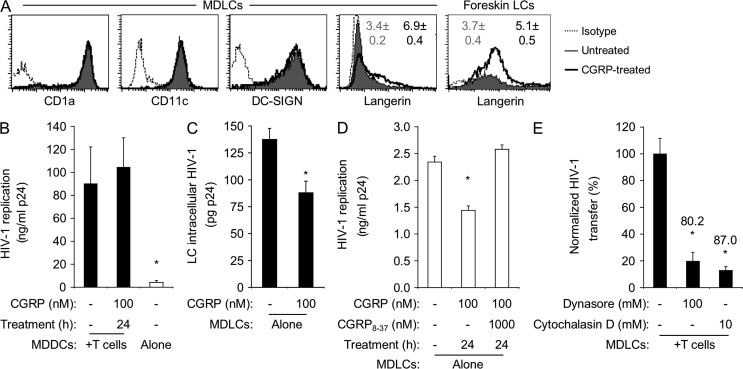
Figure 2.
CGRP increases langerin surface expression and decreases HIV-1 replication. (A) Representative FACS histograms showing surface expression of CD1a, CD11c, DC-SIGN, and langerin in untreated and CGRP-pretreated MDLCs or LCs derived from inner foreskin versus matched isotype controls. Numbers represent mean ± SEM ratios of the MFI for langerin expression (MFI langerin/MFI isotype) derived from n = 15 (MDLCs) or 5 (foreskin LCs) experiments; P < 0.0001 and 0.0352 for CGRP-treated versus untreated LCs, respectively. (B) MDDCs were left untreated or pretreated for 24 h with 100 nM CGRP, pulsed with HIV-1 at 103 TCID50, and either co-cultured with autologous CD4+ T cells or cultured alone (open bar) for 1 wk. HIV-1 replication was measured in the culture supernatants by p24 ELISA. Results represent mean ± SEM ng/ml p24 from n = 4 experiments; *, P = 0.0361 MDDCs alone versus MDDCs + T cells. (C–E) MDLCs were pretreated with CGRP (100 nM, 24 h) alone or after addition of 1,000 nM CGRP8–37 and pulsed with HIV-1 at 103 TCID50. MDLCs were then either incubated with trypsin and lysed immediately, and HIV-1 was measured in the cell lysates (C), or cultured alone in the absence of CD4+ T cells, and HIV-1 was measured in the culture supernatants 1 wk later (D). Untreated MDLCs were also pulsed with HIV-1 at 103 TCID50 in the presence of dynasore or cytochalasin D and co-cultured with autologous CD4+ T cells, and HIV-1 was measured in the co-culture supernatants 1 wk later (E). Results represent mean ± SEM LC intracellular content of HIV-1 (C; pg p24), HIV-1 replication (D; ng/ml p24), or normalized HIV-1 transfer (E; percentage) derived from n = 7, 4, and 3 independent experiments, respectively; numbers in E represent percent inhibition; *, P = 0.0054 and 0.0006 for 100 nM versus no CGRP (C and D); *, P = 0.0145 and 0.0102 for dynasore and cytochalasin D versus untreated MDLCs, respectively (E).

