Figure 3.
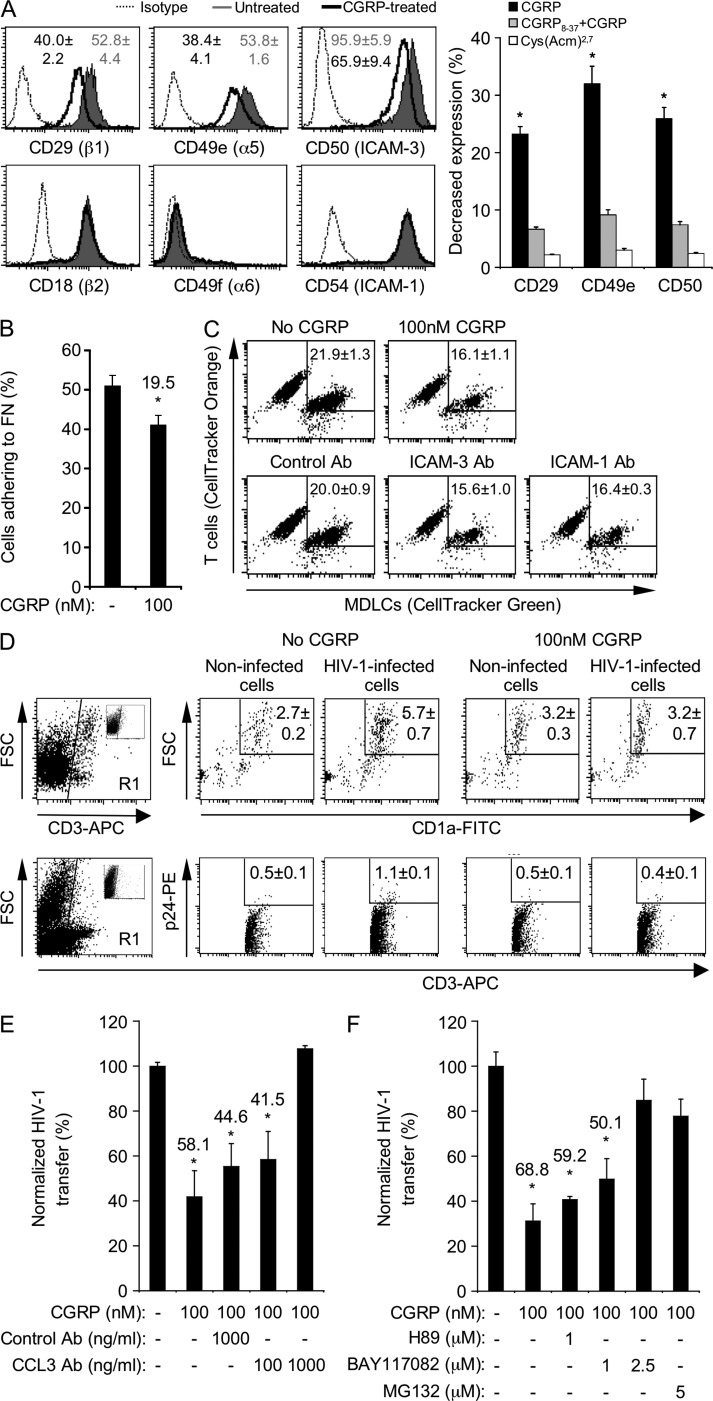
CGRP decreases LC adhesive potential, LC–T cell conjugate formation, and T cell infection and increases CCL3/MIP-1α secretion. (A) Representative FACS histograms showing surface expression of the indicated integrins in untreated or CGRP-pretreated (100 nM, 24 h) MDLCs versus matched isotype controls. Numbers represent mean ± SEM (n = 7) MFI ratios for integrin expression (MFI integrin/MFI isotype) for each surface marker; P = 0.0279 (CD29), 0.0198 (CD49e), and 0.0275 (CD50) for CGRP-treated versus untreated MDLCs, respectively. The graph represents mean ± SEM of the decrease in expression (percentage) of CD29, CD49e, and CD50 after 24-h pretreatment with CGRP alone, 1,000 nM CGRP8–37 + 100 nM CGRP, or 100 nM Cys(Acm)2,7; *, P = 0.0163, 0.0086, and 0.0252 for CD29, CD49e, and CD50 versus untreated MDLCs, respectively. (B) Mean ± SEM (n = 5) percentages of untreated or CGRP-pretreated (100 nM, 3 h) MDLCs adhering in vitro to fibronectin-coated plates; number represents percent decrease; *, P = 0.0265, 100 nM versus no CGRP. (C) Representative FACS profiles showing the percentages of conjugates forming in vitro between CD4+ T cells (CellTracker orange labeled) and MDLCs (CellTracker green labeled). (top) MDLCs were either left untreated or CGRP pretreated (100 nM, 24 h). (bottom) Untreated MDLCs were incubated with CD4+ T cells in the presence of control, ICAM-3, or ICAM-1 Ab. Numbers represent the mean ± SEM (n = 5) percentage of double-positive conjugates; P = 0.0103, 0.0097, and 0.0320 for 100 nM CGRP, ICAM-3 Ab, and ICAM-1 Ab versus no CGRP, respectively. (D) Inner foreskin explants were either left untreated (no CGRP) or CGRP pretreated (100 nM CGRP) for 24 h and exposed for 4 h to either noninfected or HIV-1–infected cells. Shown are representative FACS profiles with numbers representing the mean ± SEM (n = 3) percentages within the entire cell suspensions of either CD3+CD1a+ high FSC LC–T cell conjugates (top, epidermis) or CD3+p24+ cells (bottom, dermis). Cells were first gated on CD3+ cells (R1 gates, left profiles; insets show staining with matched isotype controls). (E and F) HIV-1 transfer experiments in the presence of control Ab or neutralizing Ab to CCL3 (E; n = 3) or the PKA inhibitor H89 or the NF-κB inhibitors BAY117082 and MG132 (F; n = 4). Results are presented as in Fig. 1. *, P = 0.0148, 0.0441, and 0.0229 for pretreatment with CGRP alone, CGRP + control Ab, and CGRP + 100 ng/ml CCL3 Ab versus untreated MDLCs, respectively (E); *, P < 0.0001 and P = 0.0004 and 0.0009 for pretreatment with CGRP alone and in the presence of 1 µM of either H89 or BAY117082 versus untreated MDLCs, respectively (F).

