Abstract
[Purpose] The purpose of this study was to perform kinematic and kinetic analyses of the ankle during both forward and backward walking using three-dimensional motion analysis. [Subjects] The subjects were 11 healthy adults. [Methods] Measurements of forward and backward walking motions were taken using a three-dimensional motion analysis device and 3 ground reaction force plates. The analysis segment was the standing phase and the items analyzed were walking time, maximum dorsal flexion of the ankle, maximum angle of plantar flexion, peak ankle power in the sagittal plane, workload of the ankle, and work rate. Statistical analysis consisted of comparisons using the t-test for each of the items measured during both forward and backward walking. [Results] The backward walking group had significantly lower ankle power, workload, and work rate. [Conclusion] The propulsive force in backward walking must come from some factor other than the ankle. The analysis of joint power is an important index for understanding the motion.
Key words: Three-dimensional motion analysis, Ankle power, Backward walking
INTRODUCTION
Backward walking has is used in a variety of situations as a form of balance training and as a preventive measure for falling. Studies analyzing the motions involved in backward walking have focused on movements of the joints. Among these studies are those indicating the patterns of movements in the joints is the reverse of forward walking and that the trajectories of motion of the two modes of walking are similar1). There are also studies that have indicated that the patterns of movements are different due to differences in the stride and speed of walking2). However, there are almost no studies that have used kinetic analysis. One of the factors used in kinetic analysis is ankle power. Ankle power is an index used to assess forward propulsive force. Ankle power is calculated by multiplying joint moment and angular velocity. Positive power indicates energy generation, which is generally related to concentric contractions, while negative power indicates energy absorption, which is related to eccentric contractions3). Therefore, plantar flexion (push off) during forward walking is indicated by a large amount of positive power generated at the ankle. Plantar flexion plays a role in forward propulsive force while walking and contributes to the stability and the initial forward motion of the lower limb prior to the swing phase4). Ankle power is an important index which provides a deeper understanding of the movements of the ankle, and the objective of this study was to perform kinematic and kinetic analyses of the ankle during both forward and backward walking using three-dimensional motion analysis.
SUBJECTS AND METHODS
The subjects were 11 healthy adults (4 women, 7 men; average age: 23.8±4.6 years; average height 167.5±8.5 cm; average weight 59.9±12.6 kg). The main study objectives and methods were explained to the subjects, and they were informed that their decision whether or not to participate in the study would in no way reflect unfavorably on them. Their written consent was then obtained. This study was approved by the ethics committee of Heisei College of Health Sciences.
Measurements of forward and backward walking motions were made using a VICON NEXUS three-dimensional motion analysis device (VICON, 6 cameras, sampling frequency 100 Hz) and 3 ground reaction force plates (sampling frequency 1000 Hz). Infrared markers 14 mm in diameter were placed on 35 sites using the plug-in-gait full body model (VICON). Measurements were taken of natural walking (speed and stride were chosen by the walkers) both forward and backward. Subjects repeated the walking movements several times until they were able to walk stably. The data of 3 attempts were analyzed. The analysis segment was the standing phase and the items analyzed were walking time, maximum dorsal flexion of the ankle, maximum angle of plantar flexion, peak ankle power in the sagittal plane (angular velocity×joint moment = W/kg), workload of positive ankle power (integrated value of positive ankle power), and work rate (workload/time).
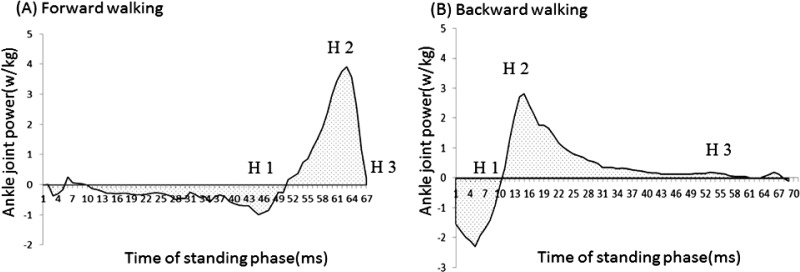
Workload analysis of the segment of plantar flexion (including the peak positive ankle power) was performed based on the ankle power curve (Fig. 1).
Fig 1.
The figure represents ankle joint power at the forward walking (A), backward walking (B) in the sagittal plane during the standing phase for a subject. The positive value of the vertical axis represents power generation. The negative value represent power absorption. H2 represents the peak positive ankle power. Workload analysis of positive power (including the peak positive ankle power) was performed based on the ankle power curve[H1-H3].
Statistical analysis consisted of comparisons using the t-test for each of the items measured during both forward and backward walking. The level of significance was chosen as 5%.
RESULTS
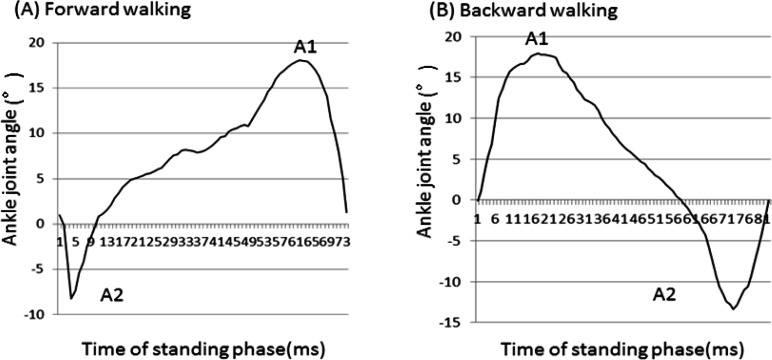
The results of the kinetic and kinematic parameters are presented in Table 1. There were no significant differences between the groups in walking time or plantar flexion/range of motion. The angle of dorsal flexion was 13.7±4.4° in the forward walking group and 20.8±5.5° in the backward walking group, indicating that the backward walking group had a significantly higher angle of dorsal flexion (Fig. 2). Ankle power was 3.3±0.7 W/kg in the forward walking group and 1.7±0.5 W/kg in the backward walking group, indicating that the backward walking group had a significantly lower ankle power. Workload was 29.7±7.5 W/kg in the forward walking group and 20.8±7.1 W/kg in the backward walking group, indicating that the backward walking group had a significantly lower workload. Power was 1.7±0.3 W/kg in the forward walking group and 0.6±0.1 W/kg in the backward walking group, indicating that the backward walking group had a significantly lower power.
Table 1. The results of the kinetic and kinematic parameters.
| Kinematic parameters | Forward walking | Backward walking |
| Time (s) | ||
| Stance time | 0.75±0.04 | 0.77±0.03 |
| Ankle joint angle (°) | ||
| Dorsiflexion (A1) | 13.7±4.4 | 20.8±5.5** |
| Plantarflexion (A2) | 9.7±7.0 | 10.8±7.9 |
| Joint power (W/kg) | ||
| Ankle Positive peak power (H2) | 3.3±0.7 | 1.7±0.5** |
| Workload (W/kg)(H1-H3) | 29.7±7.5 | 20.8±7.1** |
| Work rate (W/kg/ms) | 1.7±0.3 | 0.6±0.1** |
Values are means±SD
** : p<0.01
Fig 2.
The figure represents ankle joint angle at the forward walking (A), backward walking (B) in the sagittal plane during the standing phase for a subject. The positive value of the vertical axis represents dorsiflexion of the ankle joint. A1 represents maximum angle of dorsiflexion. A2 represents maximum angle of plantar flexion.
DISCUSSION
The present results suggest that the kinetic factors of ankle power and workload were lower during backward walking than in forward walking. Since there were no significant differences in walking times in this study, it is likely that plantar flexion plays only a small role in propulsion. Ankle power during forward walking included both plantar flexion caused by muscles and plantar flexion caused by the non-contractile extensibility (utilizing elastic energy) of the Achilles tendon acting as a spring5). However, the plantar flexion power of the ankle during backward walking was low even when the angle of dorsal flexion prior to plantar flexion was large. This indicates that the influence of non-contractile elastic energy on plantar flexion is small. Thus, the propulsive force in backward walking must come from some factor other than the ankle. Possible sources of the propulsive force are compensation through hip power and the center of gravity.
Power was significantly lower during backward walking. During forward walking the moment arm of plantar flexion increased as walking continued, but during backward walking it decreased. In other words, it became increasingly more difficult to exert power to generate propulsion. These were the factors behind the decrease in power.
This study elucidated kinetic differences. These differences suggest that even when the movement patterns are the same, they play different roles in forward and backward walking. Through the evaluation of ankle power, we can elucidate the contribution to the propulsive force generated by the ankle joint motion, and it is a very important index for understanding the factors of propulsive force in motion.
I would like to investigate the source of the propulsive force in backward walking in the future.
REFERENCES
- 1.Thorstensson A: How is the normal locomotor program modified to produce back walking? Exp Brain Res, 1986, 61: 664–668 [DOI] [PubMed] [Google Scholar]
- 2.Fujisawa H, Arisue I, Nishizawa S, et al. : A study on speed control during backward walking for young adults. J Jpn Phys Ther Assoc, 2010, 37: 17–21 [Google Scholar]
- 3.Taniguchi M, Tateuchi H, Takeoka T, et al. : Kinematic and kinetic characteristics of Masai barefoot technology footwear. Gait Posture, 2012, 35: 567–572 [DOI] [PubMed] [Google Scholar]
- 4.Neptune RR, Kautz SA, Zajac FE: Contributions of the individual ankle plantar flexors to support, forward progression and swing initiation during walking. J Biomech, 2001, 34: 1387–1398 [DOI] [PubMed] [Google Scholar]
- 5.Fukunaga T, Kubo K, Kawakami Y, et al. : In vivo behaviour of human muscle tendon during walking. Proc Biol Sci, 2001, 268: 229–233 [DOI] [PMC free article] [PubMed] [Google Scholar]


