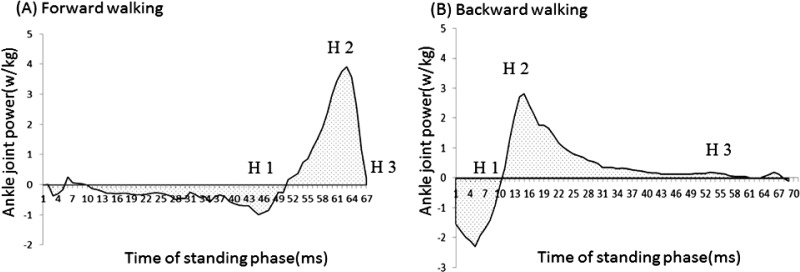
Fig 1.
The figure represents ankle joint power at the forward walking (A), backward walking (B) in the sagittal plane during the standing phase for a subject. The positive value of the vertical axis represents power generation. The negative value represent power absorption. H2 represents the peak positive ankle power. Workload analysis of positive power (including the peak positive ankle power) was performed based on the ankle power curve[H1-H3].

