
FIGURE 2. Analysis of lung macrophage M2 marker expression by flow cytometry.
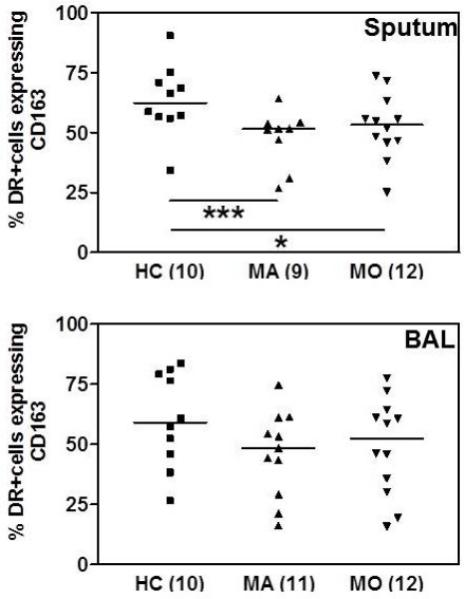
Expression of cell surface CD163 on sputum and BAL macrophages of healthy controls (HC), mild asthmatics (MA) or moderate asthmatics (MO). Bars indicate median values, numerals in parentheses indicate n. Data are expressed as percentage of Live+CD45+CD3-HLA-DR+ cells and analysed by Kruskal-Wallis ANOVA and Dunn’s Multiple Comparison test. * p<0.05, *** p<0.001.