
FIGURE 5.
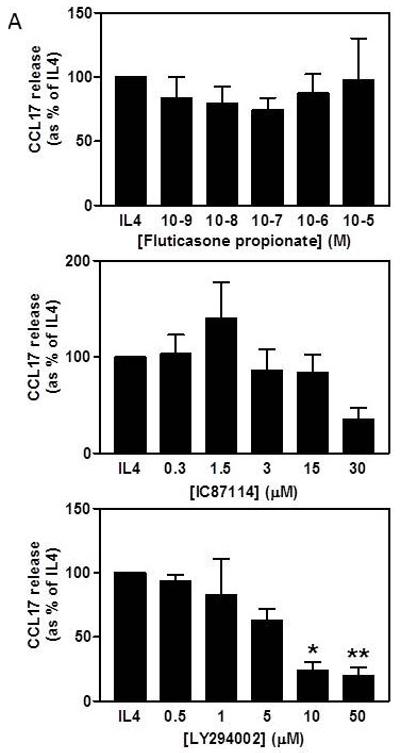
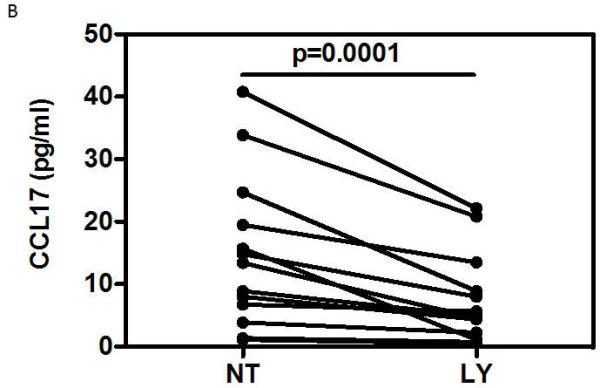
A) Effects of fluticasone propionate and PI3Kinase inhibitors on CCL17 release by IL-4-stimulated MDM. Data expressed as percentage of the maximum IL-4 stimulation (mean±SE, n=5). Data analysed by Friedman ANOVA and Dunn’s multiple comparison test. B) Effect of LY294002 on spontaneous release of CCL17 from BAL cells (medians, n=13). Data analysed using one-tailed Wilcoxon signed rank test. * p<0.05, ** p<0.01, *** p<0.001