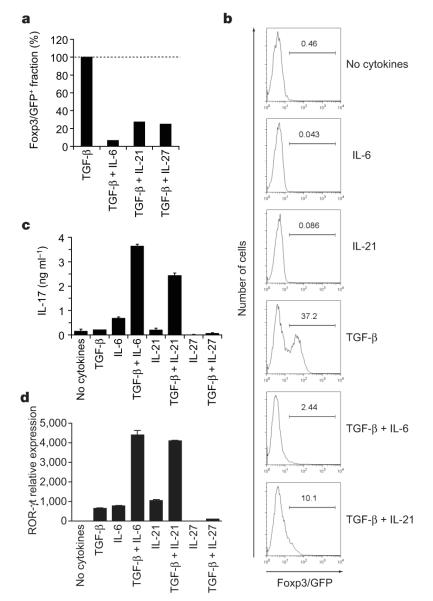
Figure 3. Inhibition of induction of Treg cells and generation of TH17 cells by IL-21.
CD4+CD62LhiFoxp3/GFP− T cells from Foxp3gfp.KI mice were stimulated with anti-CD3 and anti-CD28 for three days in the presence of the indicated cytokines. a, The expression of Foxp3/GFP was measured and the fraction of Foxp3+ cells induced by TGF-β was normalized to 100%. b, Individual histograms showing Foxp3/GFP expression. The numbers above the histogram regions (horizontal lines) represent the percentages of Foxp3/GFP+ cells. c, IL-17 production in these cultures after 48 h as measured by ELISA. d, ROR-γt expression as determined by quantitative RT–PCR in naive 2D2 (ref. 30) T cells activated for 48 h with anti-CD3 in the presence of irradiated syngeneic antigen-presenting cells and the indicated cytokines. ROR-γt expression is shown as mean and s.e.m. for duplicate determinations, relative to β-actin.

