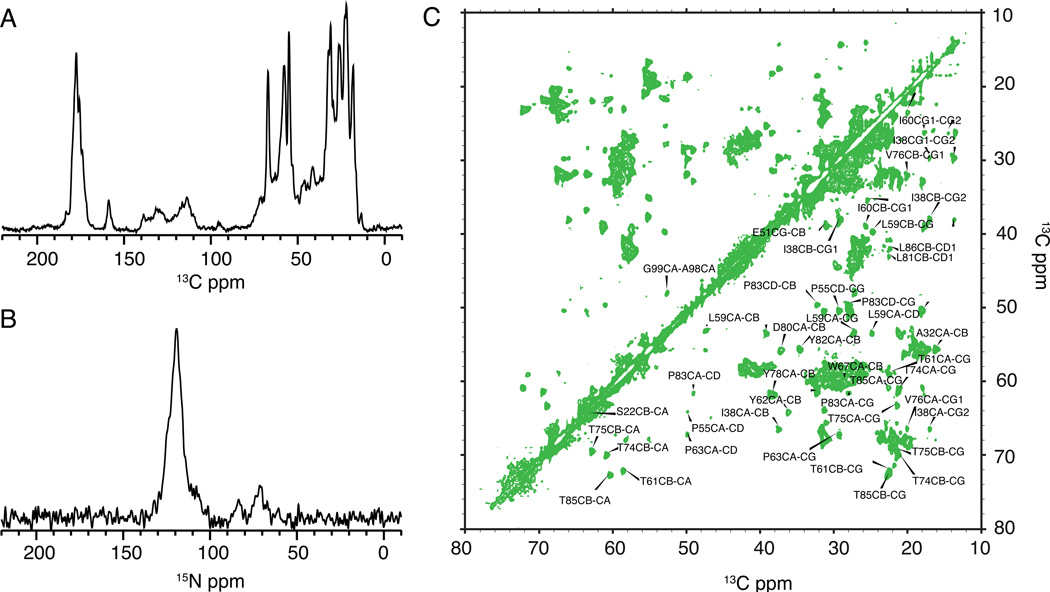
Figure 3.
Solid-state NMR spectra of ~ 10 mg of uniformly 13C-15N labeled KcsA at 50 mM K+, pH 7.5 measured on a 750 MHz instrument are shown. Panel A shows a C1D CP spectrum acquired with 32 scans acquired at an MAS of 12 KHz and a sample temperature of 0–10 C. Panel B shows a N1D CP spectrum acquired with 128 scans at an MAS of 14 KHz and the same temperature. Panel C shows the Cα-Cβ region of a 13C-13C correlation spectrum of KcsA using the DARR mixing sequence and 15ms mixing. The spectra show well-ordered narrow lineshapes for several resonances

