
Figure 2.
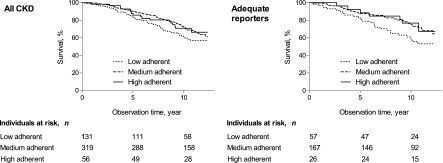
Kaplan–Meier survival curves in individuals with CKD (left panel) and the subpopulation of adequate reporters of dietary intake (right panel) stratified by their degree of adherence to a Mediterranean diet.
Official websites use .gov
A
.gov website belongs to an official
government organization in the United States.
Secure .gov websites use HTTPS
A lock (
) or https:// means you've safely
connected to the .gov website. Share sensitive
information only on official, secure websites.
Kaplan–Meier survival curves in individuals with CKD (left panel) and the subpopulation of adequate reporters of dietary intake (right panel) stratified by their degree of adherence to a Mediterranean diet.