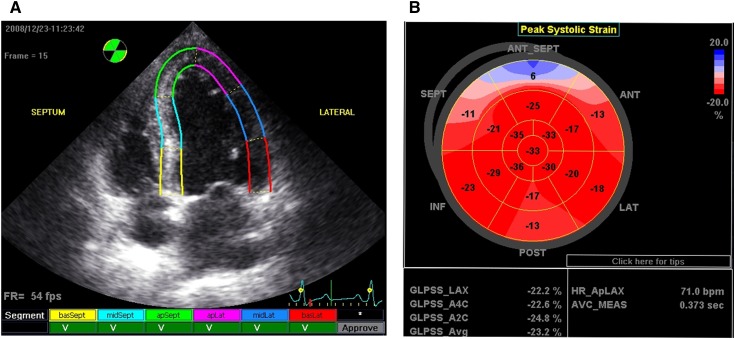
Figure 1.
Processing and presentation of GLS. Values of the peak systolic longitudinal strain from the apical long-axis, apical 4-chamber, and apical 2-chamber views were obtained from automated function imaging software. (A) Tracking quality approval screen: segments with adequate tracking are shown with a V mark. (B) The average value of peak systolic longitudinal strain in each segment calculated from three apical views was used to generate a parametric display, named GLS. GLS, left ventricular global peak systolic longitudinal strain; basSept, basal septum; midSept, midseptum; apSept, apical septum; apLat, apical lateral wall; midLat, midlateral wall; basLat, basal lateral wall; ANT_SEPT, anterior septum; ANT, anterior; LAT, lateral; POST, posterior; INF, inferior; SEPT, septum; GLPSS, global longitudinal peak systolic strain; LAX, apical long-axis; A4C, apical 4-chamber; A2C, apical 2-chamber; Avg, average; HR_ApLAX, heart rate apical long-axis; AVC_MEAS, measured aortic valve closure timing.

