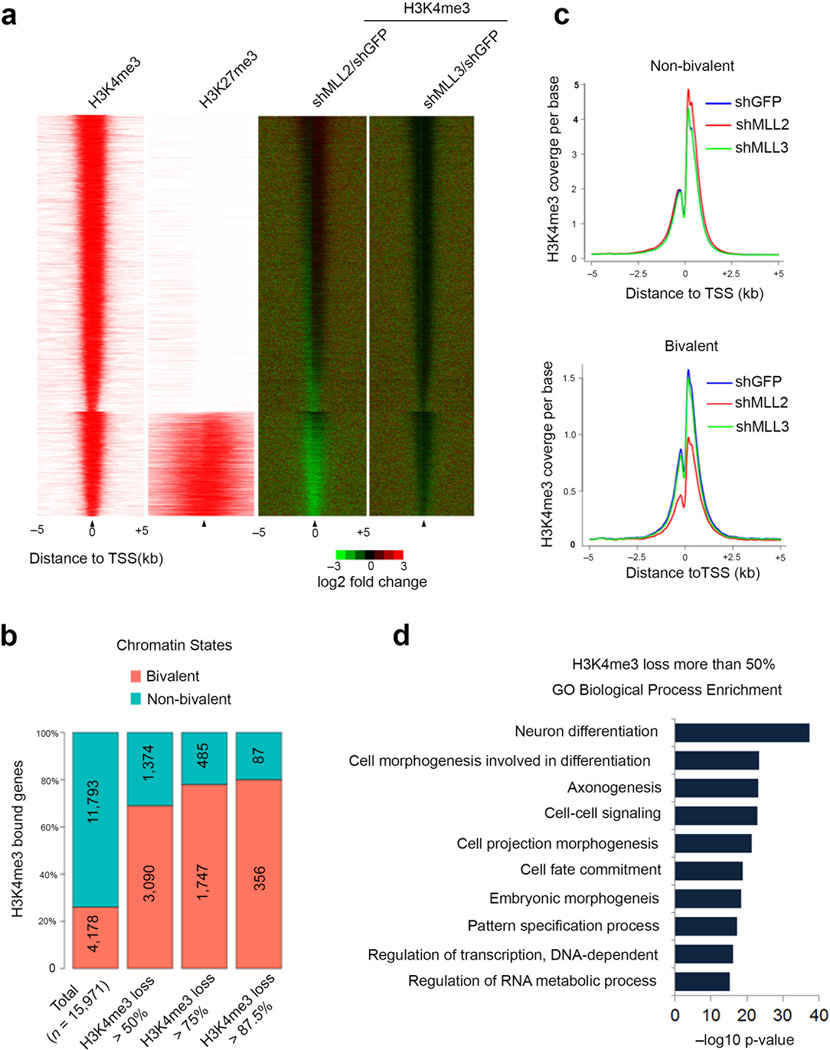
Figure 2.
Mll2 is required for the implementation of bivalency genome-wide. (a) The H3K4me3 occupancy change in the Mll2- and Mll3-depleted mouse embryonic stem cells for all H3K4me3 enriched genes. Left: ChIP-seq enrichment profiles for +/− 5kb around the TSS of all H3K4me3 enriched genes. Bivalent genes are shown as a separate group from the H3K4me3-only modified genes. Right: H3K4me3 occupancy log2 fold-change after depletion of Mll2 (shMLL2/shGFP) or Mll3 (shMLL3/shGFP) measured +/− 5kb around TSS. (b) Percentage of bivalent and non-bivalent genes with H3K4me3 occupancy loss. The percentages are shown at four levels: total H3K4me3-enriched genes, genes with more than 50% decrease of H3K4me3, genes with more than 75% decrease, and genes with more than 87.5% decrease. Numbers shown are the total number of genes for each level. H3K27me3 data in a,b are from Wamstad et al.20 (c) Average-gene occupancy plots of H3K4me3 in wild-type (shGFP) (blue line), shMll2 (red line) and shMll3 (green line) knockdown embryonic stem cells. Top and bottom panels show non-bivalent and bivalent genes, respectively. Plots are averaged from both H3K4me3 ChIP-seq biological replicates. (d) Gene Ontology analysis of genes with H3K4me3 loss after Mll2 knockdown. Benjamini-corrected p-values are shown.

