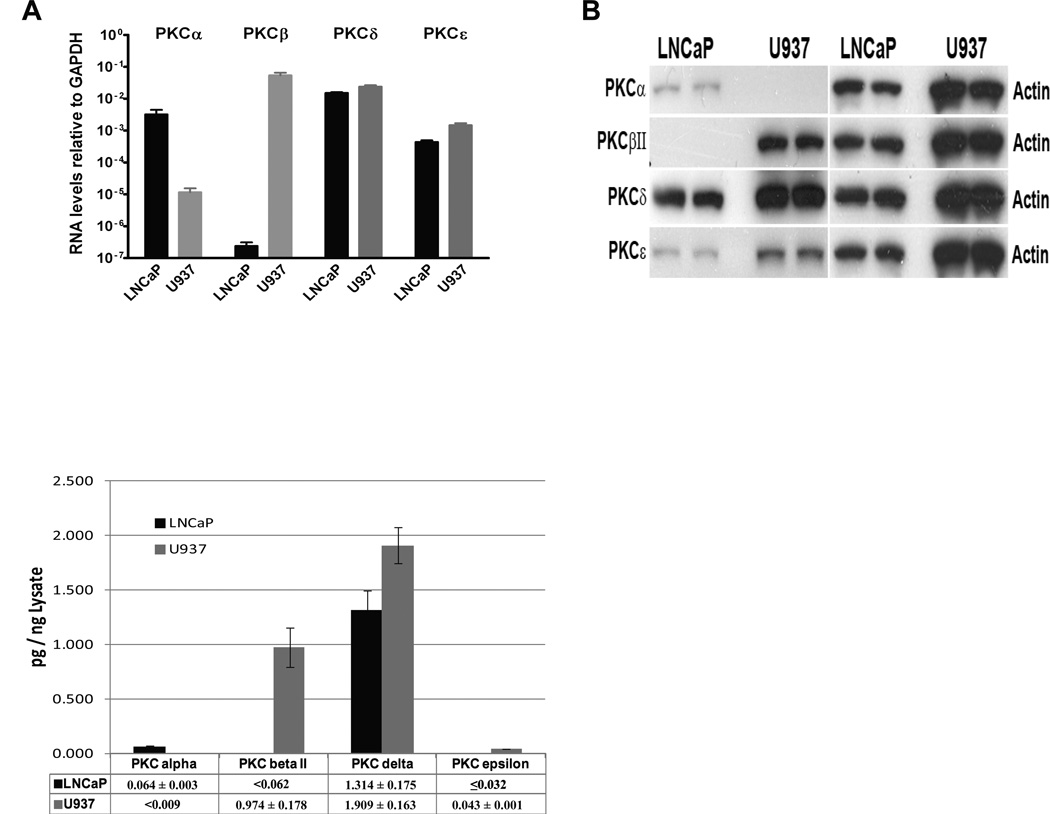
Figure 3. PKC isoform comparison in LNCaP and U937 cells.
(A) qPCR quantitation of PKC isoforms. Real time RT-PCR analysis was performed on RNA prepared from LNCaP and U937 cells using predesigned and validated primers for the indicated genes and GAPDH as control. Data represent average ± SEM values from three independent experiments. (B) Conventional western blot analysis. 15 g total cell lysates prepared from LNCaP and U937 cells were separated on SDS-PAGE, electro-transferred and immunoblotted with the indicated antibodies. Representative images using the same ECL exposure time for all PKC signals from three independent experiments are shown. The -actin signal was used as loading control. (C) Absolute quantitation of PKC isoform proteins using methods described in Figure 1. Data represent mean ± SD values from at least three independent experiments (see supplemental table for detail).

