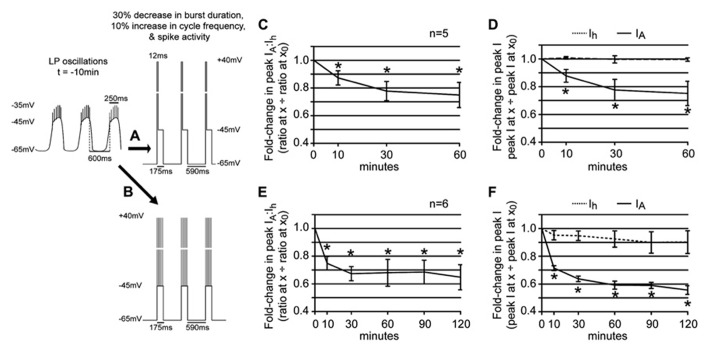
FIGURE 6.
Spike activity influences the LP IA:Ih ratio in 5 μM DA. (A,B) Diagrams of recurrent voltage steps that were applied during 5 μM DA application. Spikes are not drawn to scale. Note the recurrent step mimicked the DA-induced decrease in LP burst duration and cycle period. In addition, it mimicked spike activity. In (A), spike activity is represented as a single depolarizing step to +40 mV. The duration of the step = 6 spikes × 2 ms = 12 ms. In (B), the six spikes are represented as 6, 2 ms depolarizations to +40 mV. The time between each depolarization is 0.66 x average ISI in ms at t = -10 min. (C) Plot of the fold-changes in the LP IA:Ih ratio (mean ± SEM) throughout a 1 h superfusion with 5 μM DA and implementation of the recurrent voltage step indicated by protocol A. The ratio significantly decreased with time; *p < 0.05, repeated measures ANOVA with Dunnett’s post hoc tests that compare all time points to t = 0 (see text). (D) Plots of the fold-changes in peak LP IA and Ih (mean ± SEM) from the same experiments as in (C); *p < 0.05 for IA only, repeated measures ANOVAs with Dunnett’s post hoc tests (see text). (E) Plot of the fold-changes in the LP IA:Ih ratio (mean ± SEM) throughout a 2 h superfusion with 5 μM DA and implementation of a recurring voltage step indicated by protocol B. The ratio significantly decreased with time; *p < 0.05, repeated measures ANOVA with Dunnett’s post hoc tests that compare all time points to t = 0, F(5,4) = 8.728, p = 0.0002. (F) Plots of the fold-changes in peak LP IA and Ih (mean ± SEM) from the same experiments as in (E). Note that although LP Ih is slowly reduced, repeated measures ANOVAs with Dunnett’s post hoc tests that compare all time points to t = 0 indicate that only the decrease in LP IA is statistically significant [LP IA: F(3,4) = 19.66, p < 0.0001; LP Ih, F(3,4) = 1.218, p = 0.3456]; *p < 0.05.

