
Fig. 3.
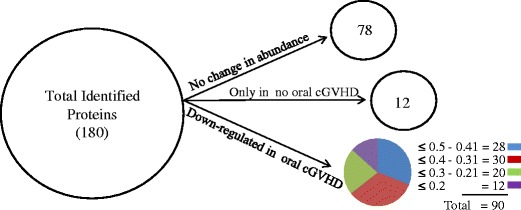
Distribution of differentially expressed proteins. Differentially expressed proteins (n = 180) were categorized using an arbitrary fold ratio change cut-off of ≤ 0.5 or ≥ 2 into proteins that did not change in abundance (n = 78), proteins that were identified only in the No oral cGVHD group (n = 12), and proteins that were down-regulated in the Oral cGVHD samples (n = 90). The number of proteins in each pathway is given above each bar