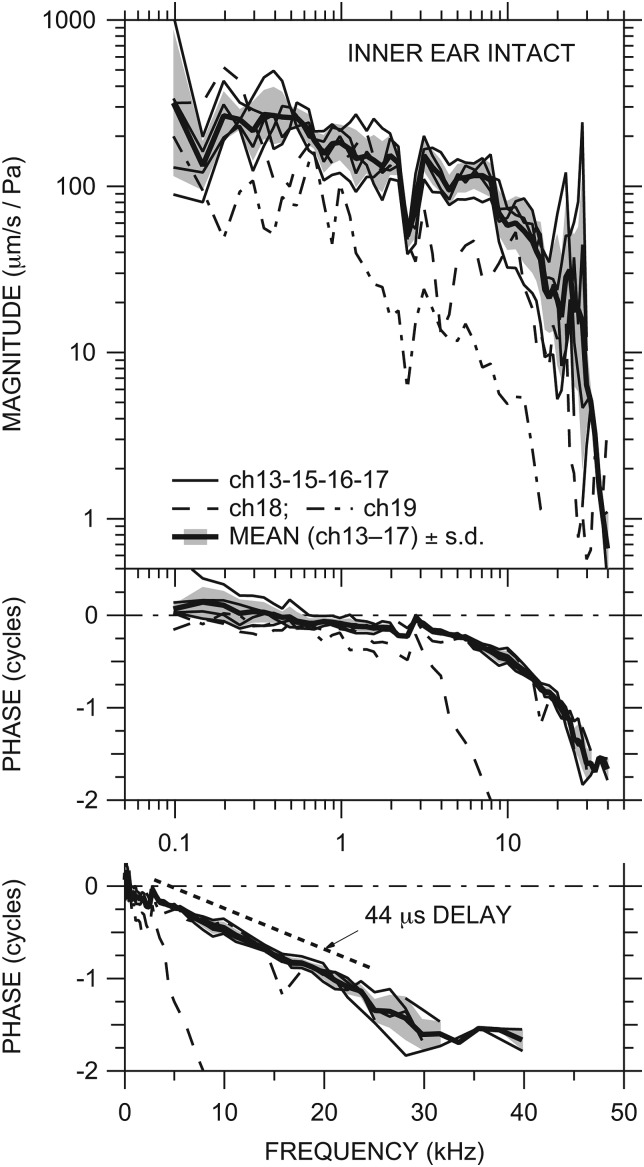
Figure 2.
Middle-ear velocity transfer function HV (stapes velocity VS normalized by Pnear-TM) in six ears with the IE intact: ch18 and ch19 (dashed and dot-dashed lines, respectively) and others (thin solid lines). Also shown is the mean HV (thick solid line) of all ears except ch18 and ch19 ± 1 standard deviation (s.d.—shaded area; see text). Top: magnitude; middle: phase; bottom: phase on a linear frequency scale. ∠HV in ear ch18 reaches −4.5 cycles by 30 kHz. The phase slope corresponding to a constant delay of 44 μs is shown between 3 and 25 kHz by the dotted line.

