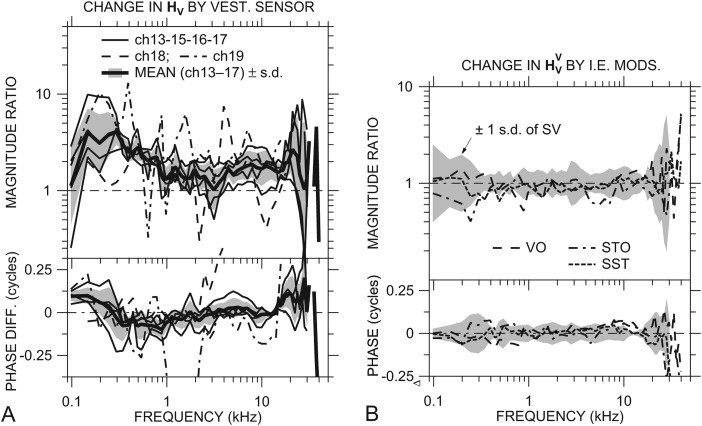
Figure 3.
(A) Effect of a sensor in the vestibule on HV in individual ears: rHV = /HV. Data for ch18 and ch19 are shown by dashed and dot-dashed lines, respectively; others by thin solid lines. Mean effects ±1 s.d. shown by thick solid lines and shading. (B) Ratio of normalized stapes velocity with various other inner-ear manipulations to with a sensor in the vestibule: the vestibule hole open but no sensor in place (VO), a sensor in the vestibule hole and a hole in scala tympani (STO), and sensors in both the vestibule and ST holes (SST). The gray regions are ±1 s.d. of || about 1 and of about 0. The result that the plotted ratios are generally within ±1 s.d. of suggests that the other manipulations had little additional effect on . Both panels—top: magnitude; bottom: phase.

