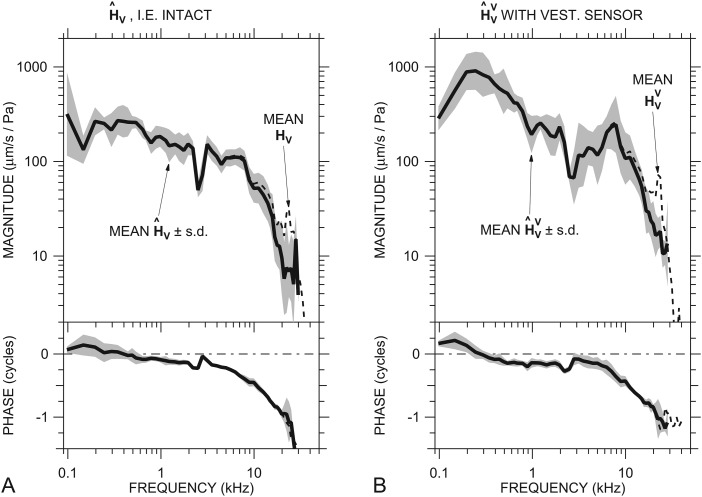
Figure 4.
Mean ME velocity transfer functions estimated using a correction for PTM derived from an ear-canal model. (A) Mean in six ears (thick solid line) ±1 s.d. (shading) estimated from HV (Fig. 2; dashed line) with the correction. (B) Mean in seven ears (thick solid line) ±1 s.d. (shading) estimated from (dashed line) with the correction. Top: magnitude; bottom: phase.

