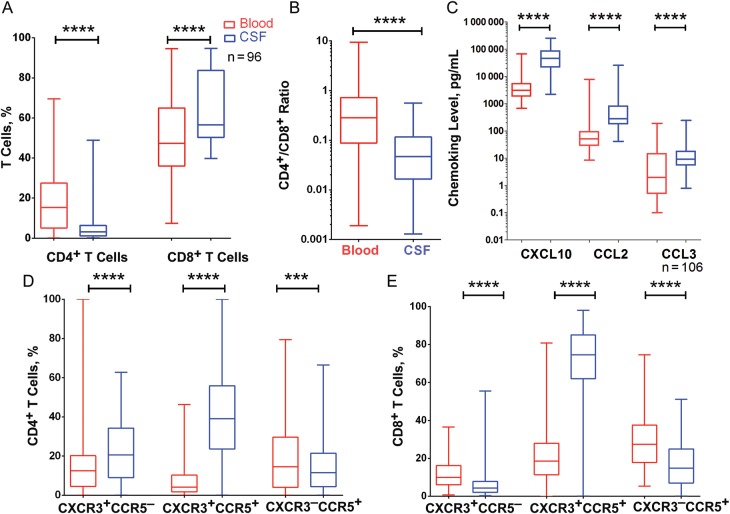
Figure 2.
Differences in cerebrospinal fluid (CSF; blue) and blood (red) before cART initiation. A, Percentage CD4+ T cells and CD8+ T cells. B, CD4+/CD8+ T cell ratio. C, Concentrations of CXCL10, CCL2, and CCL3. D,E, Proportions of CD4+ (D) and CD8+ (E) T cells expressing CXCR3, CCR5, or CXCR3/CCR5. Data are shown as box and whisker plots, with the middle, lower, and upper lines of boxes representing the medians and the 25th and 75th percentiles, respectively. ***P < .001; ****P < .0001.

