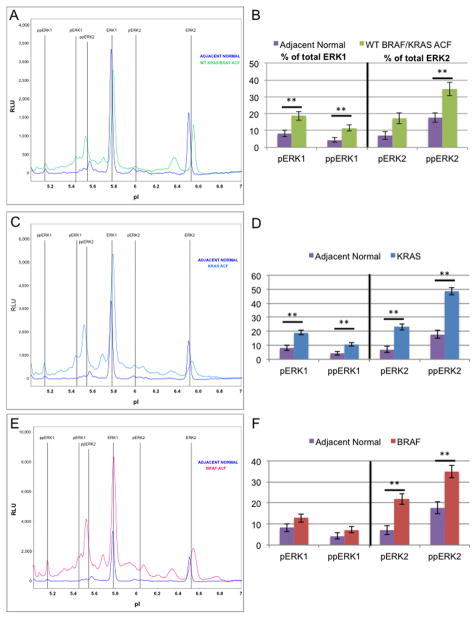
Figure 4. ERK activation state in aberrant crypt foci.
Microdissected colonocytes were prepared from frozen sections as described under Materials and methods. Nanofluidic proteomic immunoassays for ERK1/2 result in distinct electrophoretogram signatures (A,C,E) for ACF when compared with adjacent normal crypts (purple). Signatures shown represent three ACF genotypes: WT for BRAF/KRAS (A, green), KRAS mutant (C, blue), and BRAF mutant (E, red). Areas under the curve for each ERK1 and ERK2 phosphoform are quantified as a percent of the total ERK1 or ERK2 (B,D,F). Only WT for BRAF/KRAS ACF (B) and KRAS mutant ACF (D) have significantly elevated levels of pERK1 and ppERK1, while BRAF mutant ACF (F) have only slightly elevated (not significant) pERK1 and ppERK1 levels. All ACF significantly activate ppERK2. **: Significant using Tukey’s HSD procedure, two-sided alpha level of significance of 0.05. Error bars represent one standard deviation of the mean.

