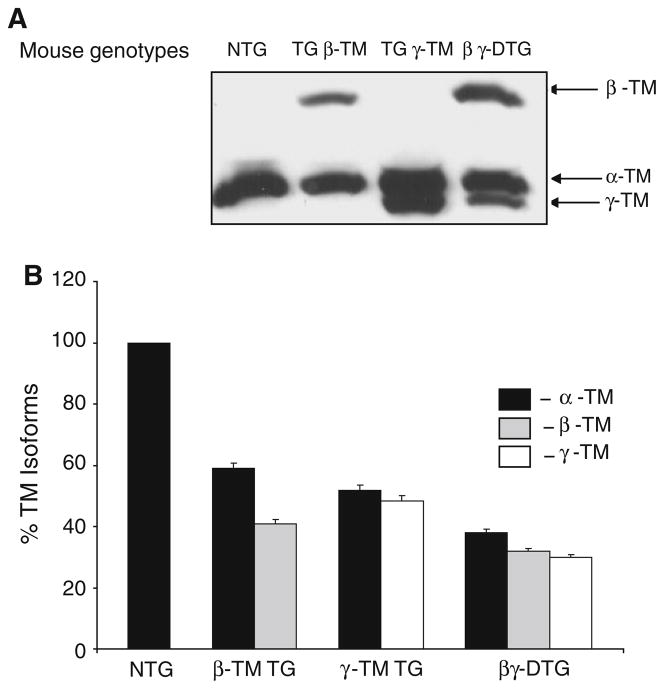
Fig. 2.
a Western blot analysis of total TM in the cardiac myofilaments of NTG and TG mice. Proteins were probed with a striated TM specific monoclonal antibody. b Quantitative analysis of the %TM isoforms in the hearts of NTG and TG mice. The signal intensity of the TM isoform distribution in the NTG, β-TM TG, γ-TM TG and βγ-DTG cardiac myofilaments was quantified with ImageQuant version 5.1. Levels within each line were set at 100% and the relative % distribution was calculated for each TM isoform. Four sets of experiments were averaged to calculate the % distribution

