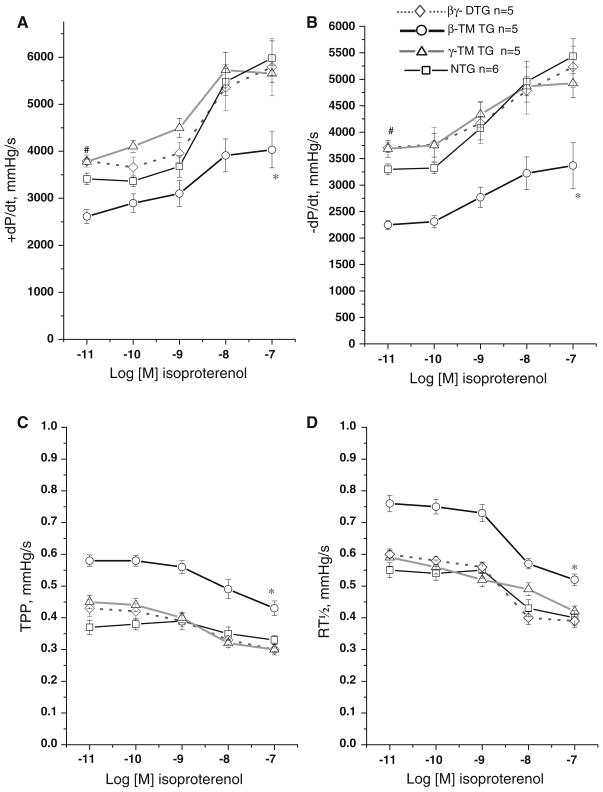
Fig. 3.
Isoproterenol dose response curves in NTG and TG mouse hearts. Mouse hearts from β-TM TG (n = 5), γ-TM TG (n = 5), βγ-DTG (n = 5) and NTG controls (n = 6) at 4 months of age were subject to isolated heart analyses with increasing concentrations of isoproterenol (10−11–10−7 mol/l). Administration of the β-adrenergic agonist isoproterenol elicits a robust positive inotropic response in γ-TM TG, βγ-DTG and NTG controls but a partially attenuated response in β-TM TG hearts. a Plot of increasing concentrations of isoproterenol versus maximum rate of pressure development; b plot of increasing concentrations of isoproterenol versus maximum rate of pressure decline; c plot of increasing concentrations of isoproterenol versus time to peak pressure; d plot of increasing concentrations of isoproterenol versus half time to relaxation. “*” Indicates the entire β-TM curve is statistically different from NTG; “#” indicates NTG at this specific concentration is statistically different from γ-TM and βγ-DTG at P < 0.05

