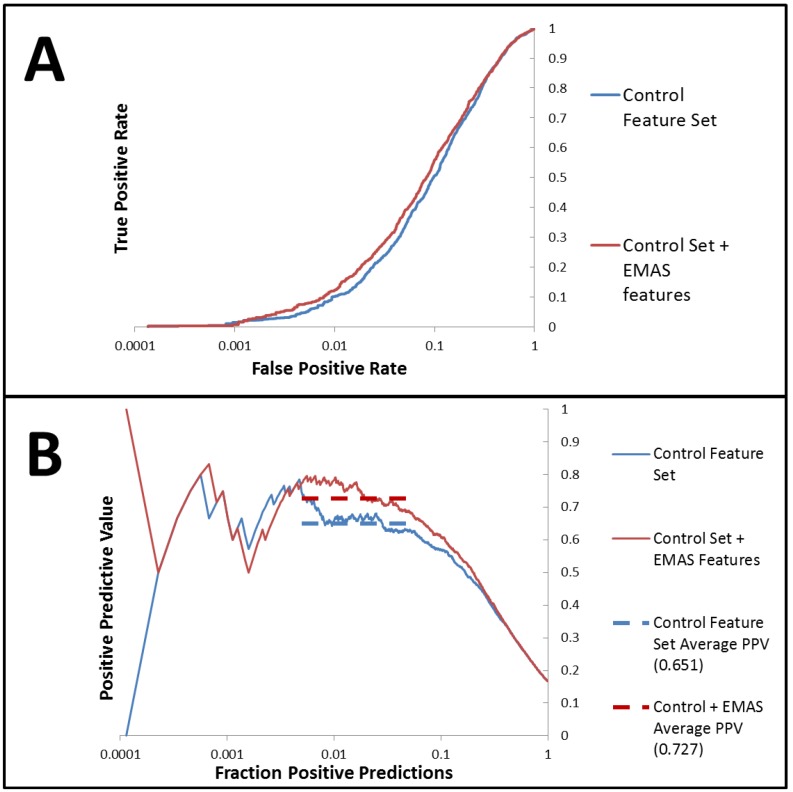
Figure 4.
ROC and PPV results for the feature forward analysis with the control set of features compared with the control set combined with EMAS features (A) AID891 prediction ROC curves generated from the ANN models trained with the best descriptor set generated from the forward feature analysis beginning with the control set of features combined with the novel EMAS features (red) show improved performance when compared with ROC curves generated from the ANN models trained with the best descriptor set generated from the forward feature analysis beginning with the control set of features (blue) (B) PPV curves for models trained with the best descriptor set of control features combined with the EMAS features (red) shows improved performance over those models trained with the best descriptor set of control features only (blue). Dashed lines of corresponding colors show the average PPV values over the FPP region from which the models were optimized (0.005 to 0.05 fraction positive predicted values).

