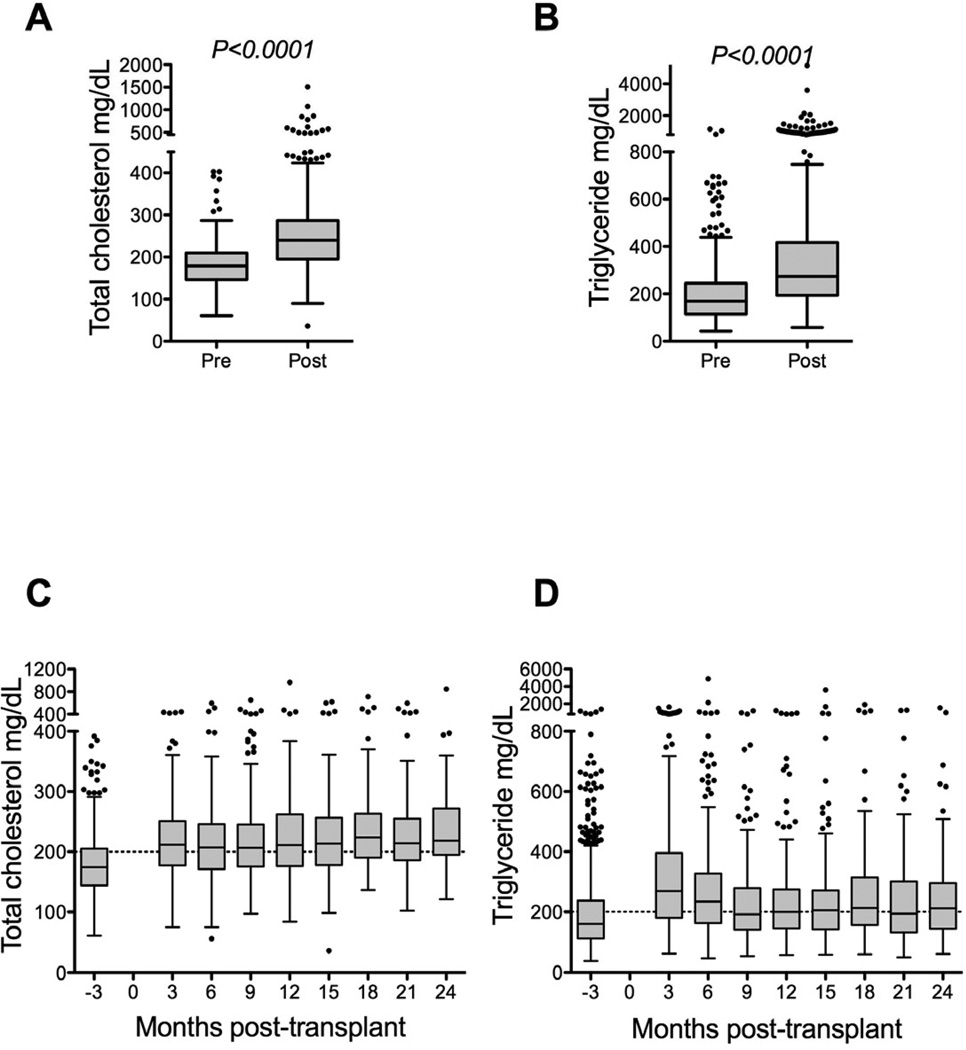
Figure 1.
(A, B) Box and whisker plots demonstrating peak total cholesterol (A, N=560) and triglyceride (B, N=554) values within the first 90 days prior to transplantation (pre) and 30 days to two years after transplantation (post). Only patients with both pre- and post-transplantation values are included in Figures 1A and 1B. (C,D) Box and whisker plots demonstrating compiled total cholesterol and triglyceride levels from all patients included in the study.

