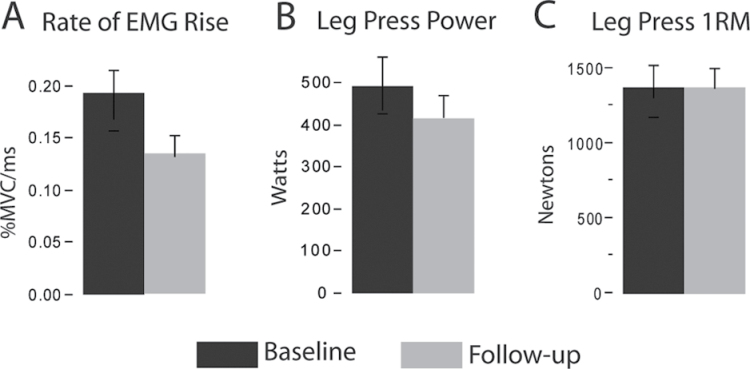
Figure 2.
Longitudinal change in neuromuscular performance. Bar graphs show the mean ± standard error. Significant reductions in the rate of electromyogram (EMG) rise (A; −28%, p = .004) and leg press power (B; −16.5%, p = .01) were observed between baseline and follow-up testing. Leg press one repetition maximum (1RM) strength (C) was unchanged.

