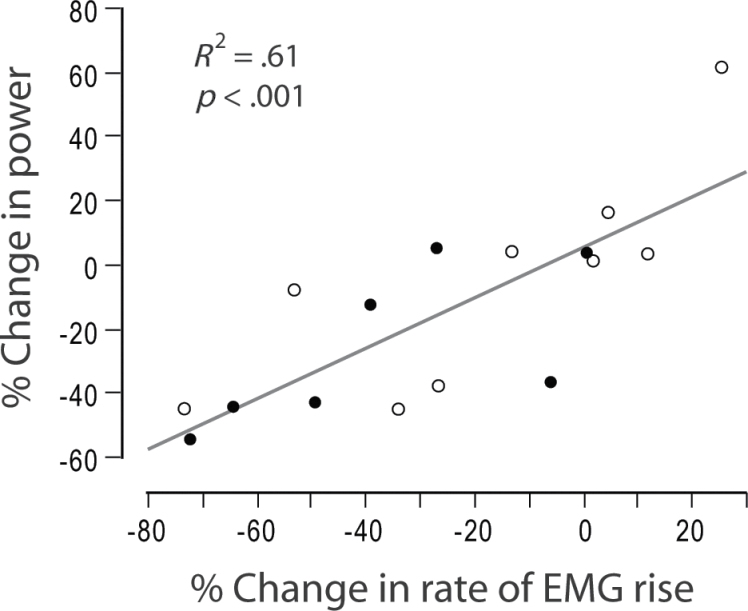
Figure 3.
Change in rate of electromyogram (EMG) rise explains change in power production. Across all participants, the change in rate of EMG rise explained 61% of the variance of change in power (p < .001). Participants diagnosed with a medical condition during the course of the study are shown as open circles, and participants without a diagnosed medical condition are shown as closed circles.

