Figure 2.
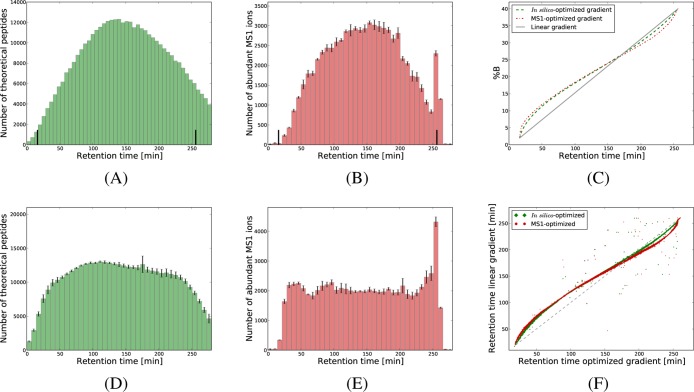
Nonlinear gradient functions. In panel A, we display the distribution of the predicted retention times for the theoretical peptides from an in silico digest of the human proteome when a linear gradient is used. Panel B gives the average number of high-intensity MS1-features for the four replicates based on a linear gradient. In panel C, we illustrate the in silico-optimized gradient designed to uniformize the distribution in panel A, and one of the four MS1-optimized gradients calculated to even one of the distributions summarized in panel B. Panel D displays the average number of theoretical peptides as a function of predicted retention time when the in silico-optimized gradient was used. Similarly, panel E gives the average number of highly abundant MS1-features yielded by the four replicates based on MS1-optimized gradients. The small segments on top of each bin give the standard deviation over the four replicates. In panel F, we considered all the peptides identified at 1% FDR in both a run based on the linear gradient, and the corresponding runs based on the nonlinear gradients. We show for each such peptide the retention time obtained with the linear gradient against the retention times in the runs based on the optimized gradients. All figures correspond to 4 h gradients, while representations for the 2 h runs are given in Supporting Informatin Figure S-2.

