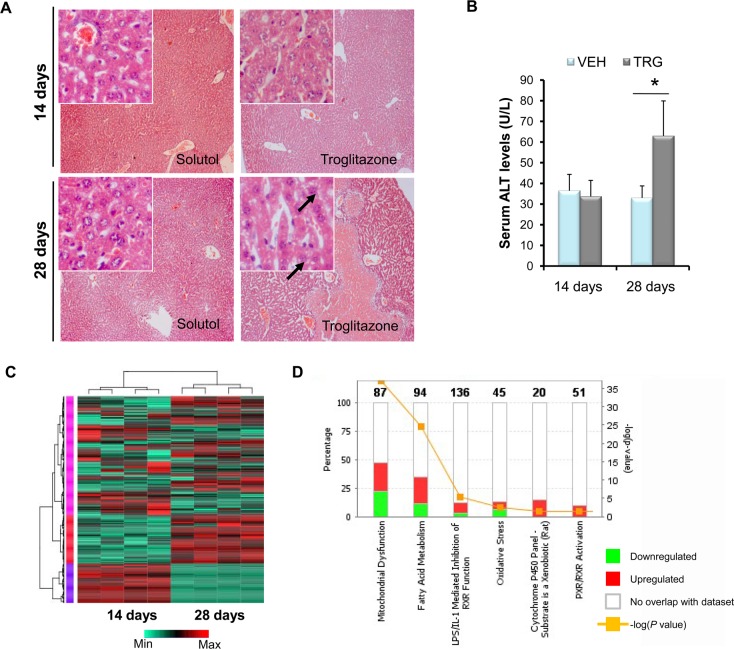
Figure 3.
Sod2 haplodeficiency delays troglitazone hepatotoxicity, as revealed by quantitative proteomics. (A) Representative hematoxylin and eosin liver sections prepared from solutol, and troglitazone-treated Sod2+/– mice dosed over either 14 days or 28 days at 100× magnification. Insets at the top left are observations made at 400×. Black arrows indicate vacuolation of hepatocytes. (B) Serum alanine aminotransferase levels of Sod2+/– mice administered with 14 days or 28 days troglitazone. (C) Hierarchical clustering with heatmap of mitochondrial proteins. The different colors on the side bars represent the three major clusters. (D) Significantly perturbed pathways in Sod2+/– liver mitochondria with troglitazone administration. The total number of proteins that make up a pathway is displayed on the top of columns. The ratio is defined as the number of proteins analyzed against the total number of proteins in a pathway. Mean ± SD values are shown. n = 3 per group; *P < 0.05. VEH, vehicle-administered; TRG, troglitazone-administered.

