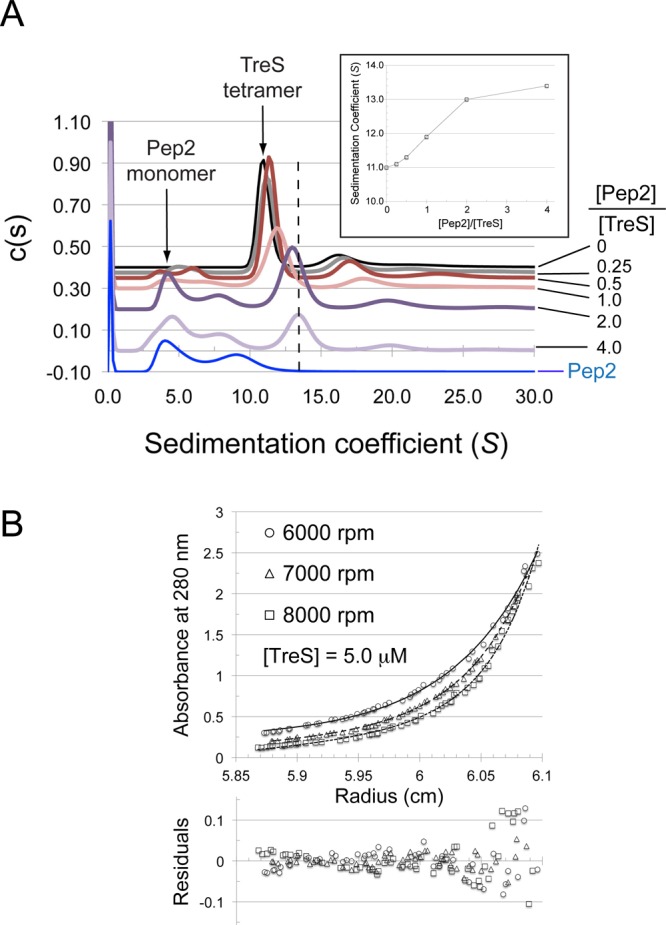
Figure 5.

Sedimentation behavior of TreS in the absence and presence of Pep2. (A) Sedimentation velocity analysis of TreS, Pep2, and molar mixtures of the two as indicated on the right of the panel (absolute concentration of TreS at 4.5 μM). With the exception of the trace in blue (Pep2 alone, 9 μM), c(s) traces have been spaced along the vertical axis according to the molar ratio of [Pep2]/[TreS]. Arrows indicate the positions of the Pep2 monomer and TreS tetramer, respectively. The dashed line highlights the shift of the TreS tetramer peak in response to the addition of Pep2. (Inset) Sedimentation coefficient of the TreS tetramer peak as a function of the concentration ratio [Pep2]/[TreS]. (B) Sedimentation equilibrium analysis of the TreS:Pep2 complex. Fit of a noninteracting species model consisting of the TreS:Pep2 complex and free Pep2 (fixed at 52 kDa). TreS and Pep2 are at a concentration of 5 and 10 μM, respectively. Rotation speeds are indicated. Equilibrium was allowed to establish over a 24 h period at each speed, and several absorbance scans were recorded per rotation speed, the last of each was used in the data analysis.
