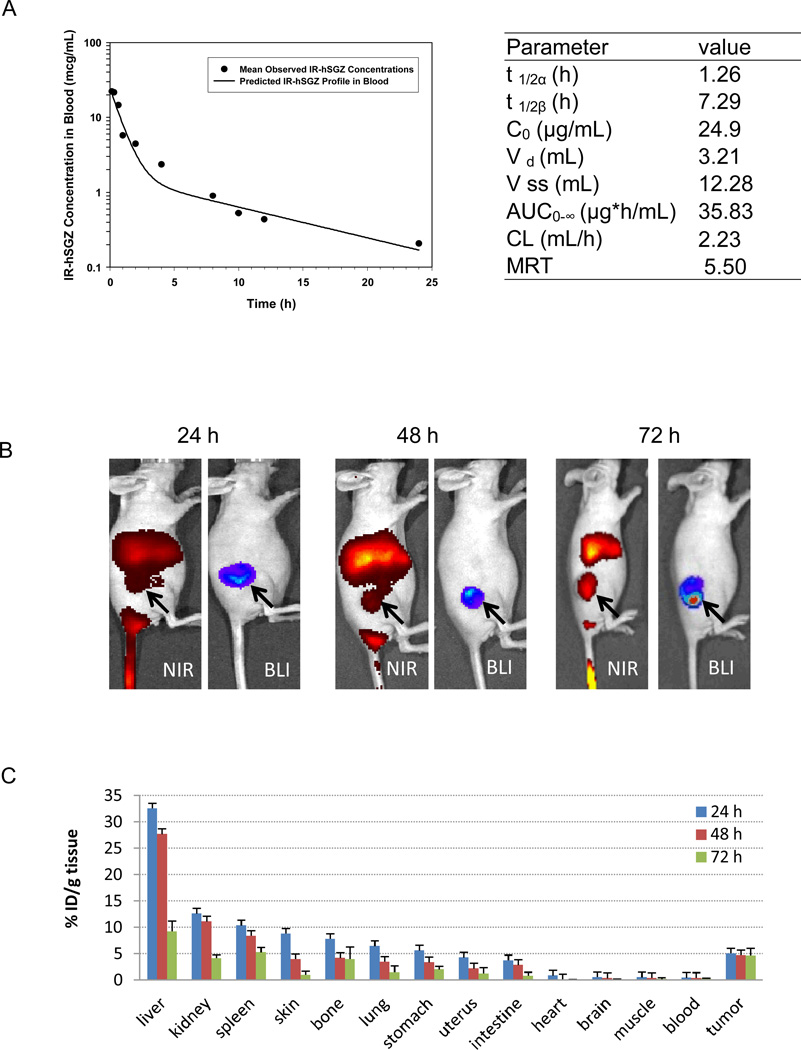
Figure 4.
Pharmacokinetics and biodistibution of IRDye 800CW-labeled hSGZ (IR-hSGZ) in mice. A, pharmacokinetic of IR-hSGZ. The IR-hSGZ was injected intravenously into BALB/c mice. Groups of mice (3 mice per group) were sacrificed at various time points after injection. The fluorescent activity in plasma was assessed, and the mean blood concentration–time profile of IR-hSGZ generated using a least squares nonlinear regression. t 1/2α and t 1/2β represent half-lives in initial distribution phase and terminal elimination phase, respectively; C0 is the estimated initial drug concentration in the blood; Vd is the volume of distribution of central compartment; Vss is volume of distribution at steady state; AUC0-∞ is the area under the blood concentration versus time curve; CL is total body clearance; and MRT is mean resident time. B, whole body imaging results of the nude mice bearing MDA-MB-231/Luc tumors intravenously injected with IR-hSGZ and imaged at 24, 48 and 72 h. The BLI images show only tumor burden. NIR, Near-infrared imaging; BLI, Bioluminescent imaging. Arrow indicates tumor burden. C, biodistribution of IR-hSGZ at 24, 48 and 72 h after intravenous injection of IR-hSGZ in nude mice bearing MDA-MB-231/Luc tumors. Data are presented as percentage of injected dose per gram of tissues (%ID/g tissue), represented as mean ± SD (n=5).

