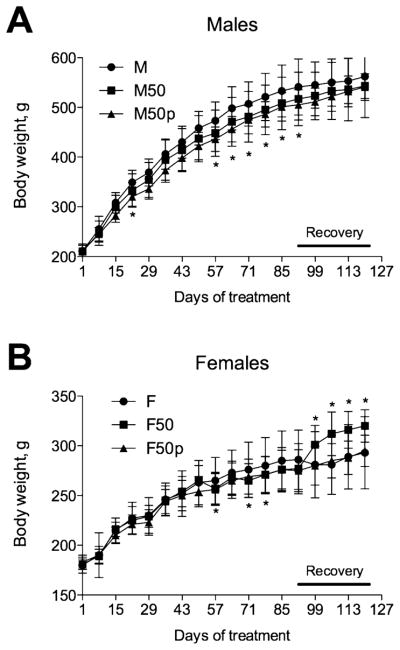
Figure 5.

Dose–response curve of body weight changes to incarnatin administration during 90 days of dosing and 28 days of recovery phase of the subchronic toxicity study. (A) Male or (B) female rats (n = 15) were orally administered with vehicle (Ctr) or 50 mg/kg per day of incarnatin. Ten animals from each group were sacrificed following a 90 day dosing phase, while five animals from control and 50 mg/kg incarnatin groups were allowed to recover for an additional 28 days. All values are means ± SEMs (n = 5–10). Asterisks indicate a significant difference (*p < 0.05) from control animals.
