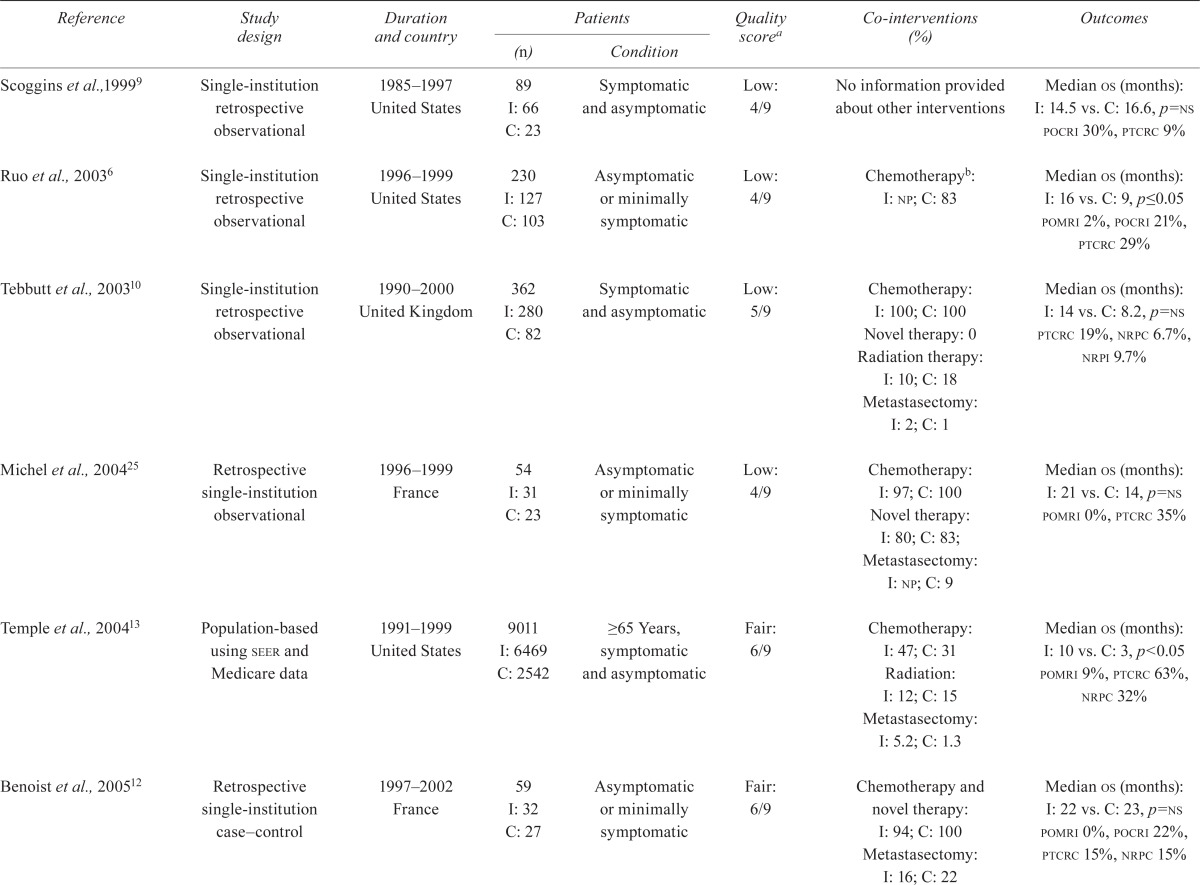
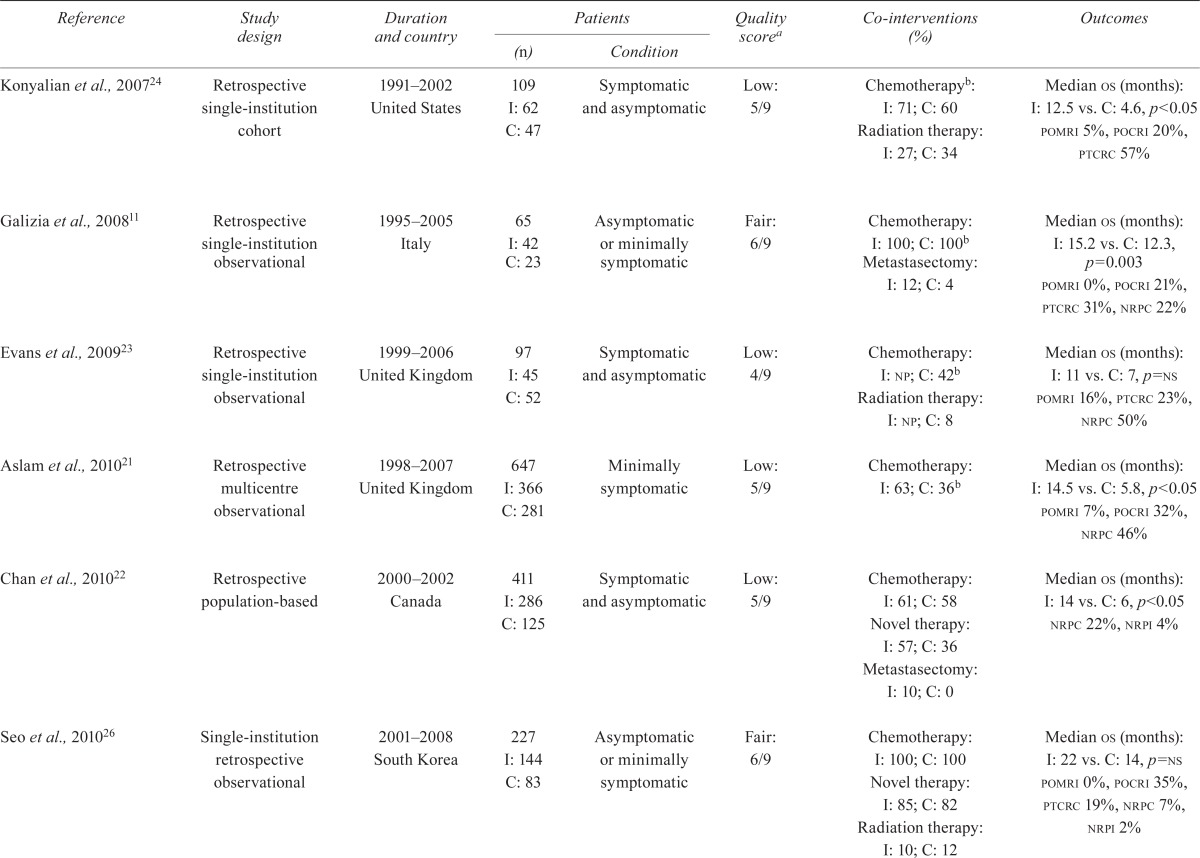
TABLE I.
Study characteristics: design, quality, population, interventions, and outcomes of interest


| Reference | Study design | Duration and country |
Patients
|
Quality scorea | Co-interventions (%) | Outcomes | |
|---|---|---|---|---|---|---|---|
| (n) | Condition | ||||||
| Scoggins et al.,19999 | Single-institution retrospective observational | 1985–1997 United States |
89 I: 66 C: 23 |
Symptomatic and asymptomatic | Low: 4/9 | No information provided about other interventions | Median os (months): I: 14.5 vs. C: 16.6, p=ns pocri 30%, ptcrc 9% |
| Ruo et al., 20036 | Single-institution retrospective observational | 1996–1999 United States |
230 I: 127 C: 103 |
Asymptomatic or minimally symptomatic | Low: 4/9 | Chemotherapyb: I: np; C: 83 | Median os (months): I: 16 vs. C: 9, p≤0.05 pomri 2%, pocri 21%, ptcrc 29% |
| Tebbutt et al., 200310 | Single-institution retrospective observational | 1990–2000 United Kingdom |
362 I: 280 C: 82 |
Symptomatic and asymptomatic | Low: 5/9 | Chemotherapy: I: 100; C: 100 Novel therapy: 0 Radiation therapy: I: 10; C: 18 Metastasectomy: I: 2; C: 1 |
Median os (months): I: 14 vs. C: 8.2, p=ns ptcrc 19%, nrpc 6.7%, nrpi 9.7% |
| Michel et al., 200425 | Retrospective single-institution observational | 1996–1999 France |
54 I: 31 C: 23 |
Asymptomatic or minimally symptomatic | Low: 4/9 | Chemotherapy: I: 97; C: 100 Novel therapy: I: 80; C: 83; Metastasectomy: I: np; C: 9 |
Median os (months): I: 21 vs. C: 14, p=ns pomri 0%, ptcrc 35% |
| Temple et al., 200413 | Population-based using seer and Medicare data | 1991–1999 United States |
9011 I: 6469 C: 2542 |
≥65 Years, symptomatic and asymptomatic | Fair: 6/9 | Chemotherapy: I: 47; C: 31 Radiation: I: 12; C: 15 Metastasectomy: I: 5.2; C: 1.3 |
Median os (months): I: 10 vs. C: 3, p<0.05 pomri 9%, ptcrc 63%, nrpc 32% |
| Benoist et al., 200512 | Retrospective single-institution case–control | 1997–2002 France |
59 I: 32 C: 27 |
Asymptomatic or minimally symptomatic | Fair: 6/9 | Chemotherapy and novel therapy: I: 94; C: 100 Metastasectomy: I: 16; C: 22 |
Median os (months): I: 22 vs. C: 23, p=ns pomri 0%, pocri 22%, ptcrc 15%, nrpc 15% |
| Konyalian et al., 200724 | Retrospective single-institution cohort | 1991–2002 United States |
109 I: 62 C: 47 |
Symptomatic and asymptomatic | Low: 5/9 | Chemotherapyb: I: 71; C: 60 Radiation therapy: I: 27; C: 34 |
Median os (months): I: 12.5 vs. C: 4.6, p<0.05 pomri 5%, pocri 20%, ptcrc 57% |
| Galizia et al., 200811 | Retrospective single-institution observational | 1995–2005 Italy |
65 I: 42 C: 23 |
Asymptomatic or minimally symptomatic | Fair: 6/9 | Chemotherapy: I: 100; C: 100b
Metastasectomy: I: 12; C: 4 |
Median os (months): I: 15.2 vs. C: 12.3, p=0.003 pomri 0%, pocri 21%, ptcrc 31%, nrpc 22% |
| Evans et al., 200923 | Retrospective single-institution observational | 1999–2006 United Kingdom |
97 I: 45 C: 52 |
Symptomatic and asymptomatic | Low: 4/9 | Chemotherapy: I: np; C: 42b Radiation therapy: I: np; C: 8 |
Median os (months): I: 11 vs. C: 7, p=ns pomri 16%, ptcrc 23%, nrpc 50% |
| Aslam et al., 201021 | Retrospective multicentre observational | 1998–2007 United Kingdom |
647 I: 366 C: 281 |
Minimally symptomatic | Low: 5/9 |
Chemotherapy: I: 63; C: 36b | Median os (months): I: 14.5 vs. C: 5.8, p<0.05 pomri 7%, pocri 32%, nrpc 46% |
| Chan et al., 201022 | Retrospective population-based | 2000–2002 Canada |
411 I: 286 C: 125 |
Symptomatic and asymptomatic | Low: 5/9 | Chemotherapy: I: 61; C: 58 Novel therapy: I: 57; C: 36 Metastasectomy: I: 10; C: 0 |
Median os (months): I: 14 vs. C: 6, p<0.05 nrpc 22%, nrpi 4% |
| Seo et al., 201026 | Single-institution retrospective observational | 2001–2008 South Korea |
227 I: 144 C: 83 |
Asymptomatic or minimally symptomatic | Fair: 6/9 | Chemotherapy: I: 100; C: 100 Novel therapy: I: 85; C: 82 Radiation therapy: I: 10; C: 12 |
Median os (months): I: 22 vs. C: 14, p=ns pomri 0%, pocri 35%, ptcrc 19%, nrpc 7%, nrpi 2% |
| Karoui et al., 20118 | Retrospective multicentre observational | 1998–2007 France |
208 I: 123 C: 85 |
Symptomatic and asymptomatic | Low: 5/9 | Chemotherapy: I: 100; C: 99 Novel therapy: I: 89; C: 93 Metastasectomy I: 23; C: 29 |
Median os (months): I: 30.7 vs. C: 21.9, p=0.004 ptcrc 27%, nrpc 27% |
| Venderbosch et al., 20117 and Koopman et al., 200749 (cairo) | Retrospective multicentre cohort of a rcta | 2003–2004 (recruitment period) Netherlands |
399 I: 258 C: 141 |
Symptomatic and asymptomatic | Fair: 6/9 | Novel therapy: 100 in both groups | Median os (months): I: 16.7 vs. C: 11.4 |
| Venderbosch et al., 20117 and Tol et al., 200950 (cairo 2) | Retrospective multicentre cohort of a rcta | 2005–2006 (recruitment period) Netherlands |
448 I: 289 C: 159 |
Symptomatic and asymptomatic | Fair: 6/9 | Novel therapy: 100 in both groups | Median os (months): I: 20.7 vs. C: 13.4 |
Assessed using the Ottawa–Newcastle scale for nonrandomized studies (see Appendix b for score details).
Information about novel therapy (second- and third-generation anticancer therapy) was not provided. Six studies did not report postoperative mortality; eight studies did not provide postoperative morbidity; four studies did not provide information on primary tumour complication rates; six studies did not provide information on non-resection procedures in the control group, and twelve studies did not provide information on the intervention group; no study provided information about quality of life.
I = intervention group; C = control group; os = overall survival; ns = nonsignificant; pocri = postoperative nonfatal complication rate, intervention group; ptcrc = primary tumour complication rate, control group; np = not provided; pomri = postoperative mortality rate, intervention group; nrpc = non-resection procedures, control group; nrpi = non-resection procedures, intervention group; seer = Surveillance, Epidemiology and End Results; rct = randomized controlled trial.
