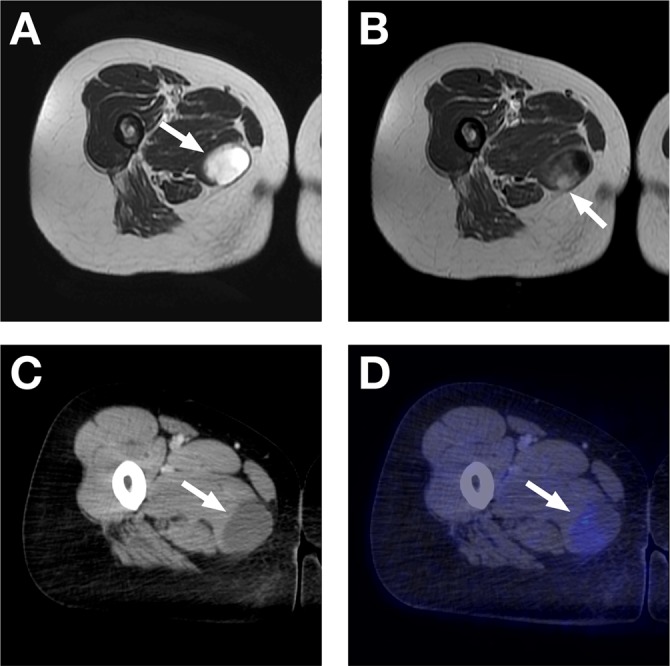
Fig. 4.

MRI and 18F-FDG PET/CT. (a) Axial T2-weighted MR image with high signal, partly cystic-appearing soft tissue lesion in the medial thigh muscle (straight arrow). (b) Axial T1-weighted MR image after intravenous Gd agent administration with contrast enhancement of the more solid-appearing region of the myxoma (straight arrow). (c) Axial CT with a soft tissue window showing the low-density, almost cystic-appearing lesion in the medial thigh muscle (straight arrow). (d) Fused PET/CT with slightly increased FDG uptake (SUV max 2.1) in the apparently more solid region of the myxoma. Notice that the region of the myxoma taking up the FDG corresponds to the Gd-enhanced region on the MRI (straight arrow)
